

Infographics can be bland, boring, and run of the mill, but you don’t have to conform! Get your message out clearly and stand out by taking your infographic vector elements to the next level. Create trendy smooth infographic vector elements and a poster design with simple shapes and limited colors in under an hour with this tutorial! We’ll make our own simple custom lettering, populate the design with simple shapes, and use only four colors.
Tutorial Details: Trendy Infographic Vector Elements
- Program: Adobe Illustrator CS6 – CC
- Difficulty: Intermediate
- Topics Covered: Shape Building, Custom Text, Gradients
- Estimated Completion Time: 40 Minutes
Final Image: Trendy Infographic Vector Elements

Step 1: Trendy Infographic Vector Elements
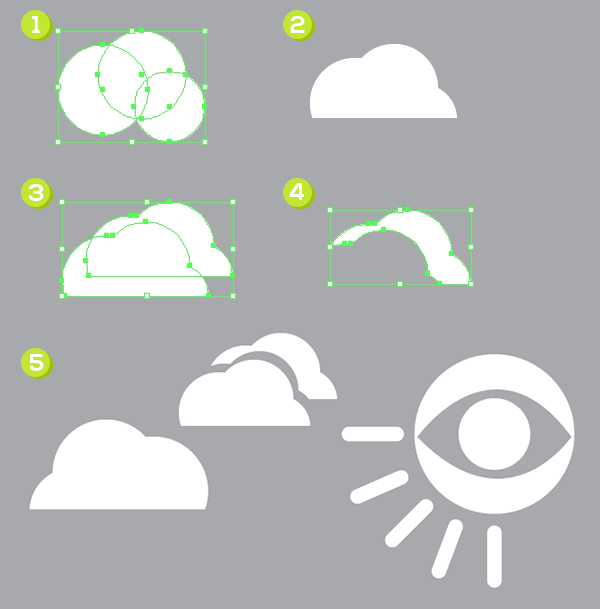
To start out our trendy infographic vector elements tutorial, create a new document of approximately 7″ by 9″ (or whatever you want your poster design to be). Draw a large rectangle around the artboard in gray with the Rectangle Tool (M). Let’s start with the first element of our design: the sun! Draw a circle with the Ellipse Tool (L). Using the Pen Tool (P), draw a gray almond shape in the center of the circle. Then, draw a small white circle in the center of the gray almond.

Step 2
Group (Control-G) together your eye shapes. Draw rounded rectangles for the sun’s rays. You can adjust the corner radii in the Transform panel or manually with the Direct Selection Tool (A) and Live Corners.

Step 3
Moving on to the next infographic vector elements: the clouds! Draw three or four overlapping circles with the Ellipse Tool. Unite all three shapes in the Pathfinder panel. Overlap the bottom third of the cloud shape with a rectangle and hit Minus Front to give your cloud a flat bottom edge. Copy (Control-C) and Paste (Control-V) two instances of the cloud and offset one from the other. Hit Minus Front in the Pathfinder panel to create a cut-out cloud. Arrange your cloud infographic vector elements near the top of your poster design.
Step 4
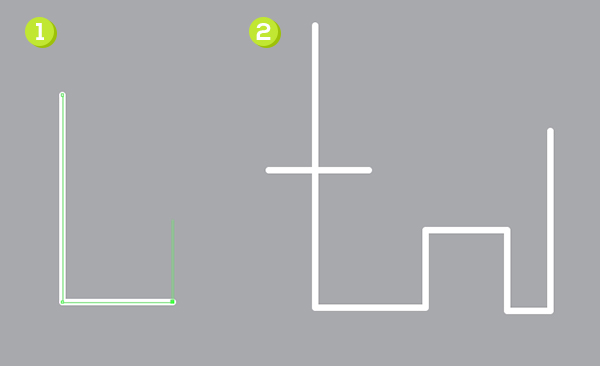
Let’s get to work on the typography portion of our design. Using the Pen Tool, start with the first “T” in “Take Me Out” by drawing an “L”; shape. Hold down Shift to keep your lines straight. Continue with blocking the top half of the “A” and the “K”. Note how everything is made up of straight lines and 90° angles at this point. In the Stroke panel, set the stroke width to 3-4pts and the corners and caps to rounded.
Step 5
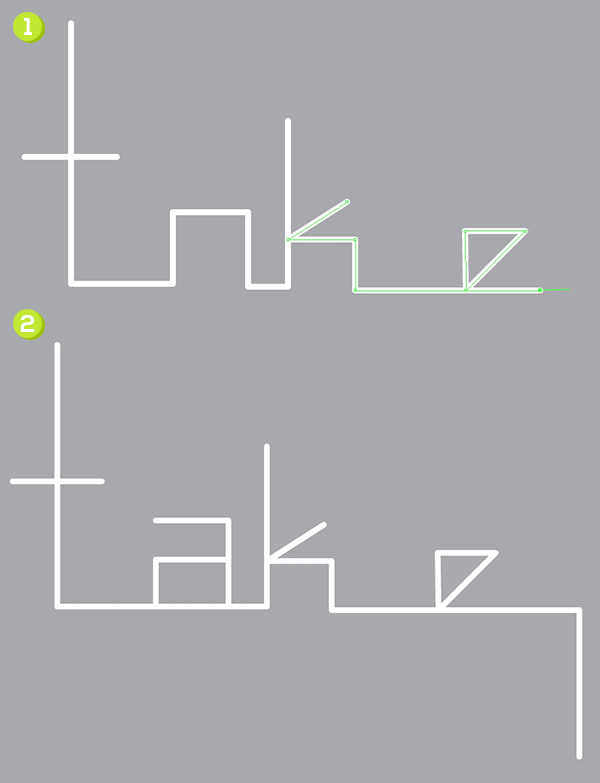
The next line starts with the “K” and moves into the “E”. The top portion of the “K” is set at a 45° angle while the bottom is at a 90° angle. The “E” is another 45° angle and should be set closer than it’s shown to the “K”. Use the Direct Selection Tool to lower half of the “A” and connect the top half with the Pen Tool and another 90° angle. Add a long line going downward to the right from the “E”. This will connect to the next line of letters.
Step 6
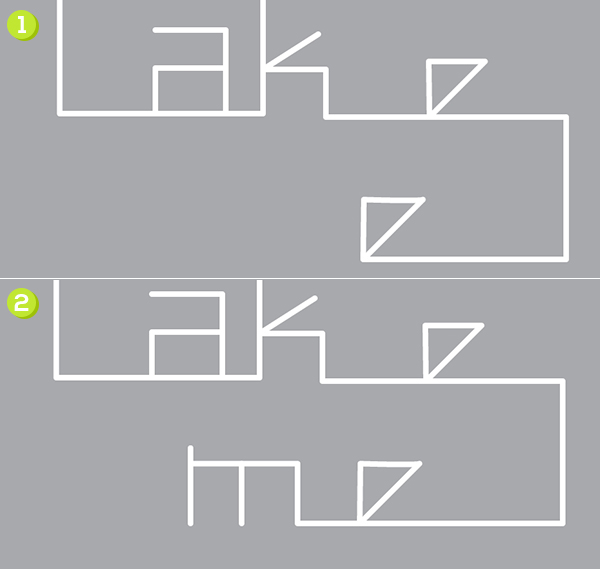
Repeat the same “E” design as was done previously on the next line. This should end your shape.
If you have Smart Guides enabled, you’ll be able to find anchor points and tangent lines more easily than without. The “M” was created with three lines. The leftmost line will connect to the next line of text below.
Step 7
Once again, work in straight lines and 90° angles to create the start of the next line of text. Create the “O” by drawing a box that turns in on itself (it’s one line from the “M” to the “O”). Draw a straight line from the bottom edge of the “O” to the right. Two vertical straight lines of the same height make up the “U”.
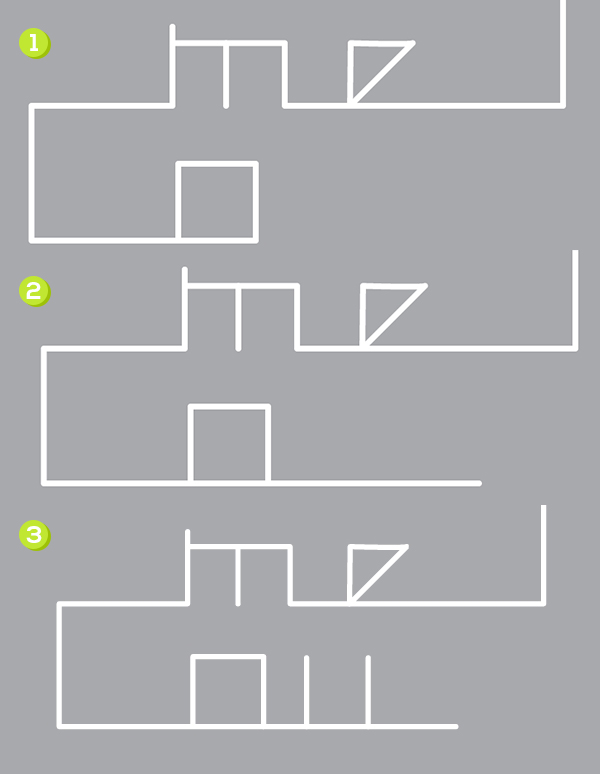
Step 8
Complete the lettering as shown below. The second “T” is smaller than the first. Make sure each letter on each line is of a similar distance so it’s easily read. Also make sure the vertical lines between lines of typography line up. This is where using Smart Guides comes in handy. Group your text together.

Step 9
Let’s start adding shapes of color. Draw magenta, blue, and yellow rectangles with the top or bottom edges rounded (pull the corresponding Live Corners inward). Place them behind the text shapes in the Layers panel.
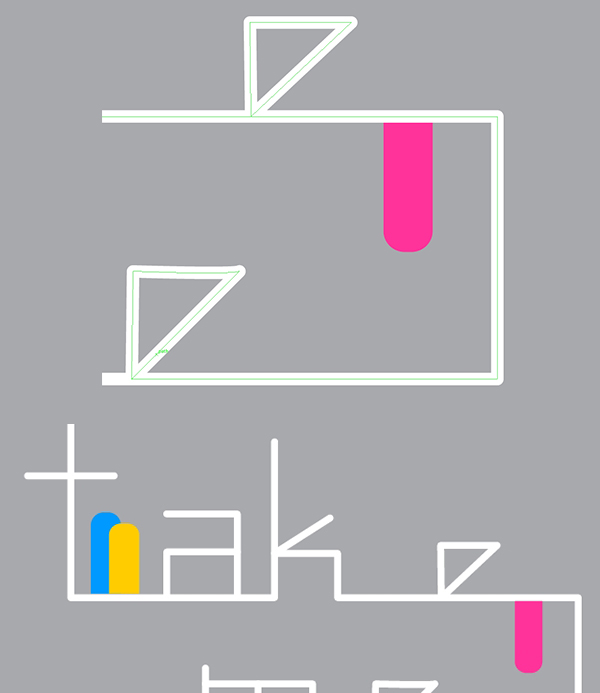
Step 10
Set the fill color of the sun shapes to yellow. Draw a circle for the lower corner and cut out one quarter of it by overlapping the upper right quarter with a rectangle and hitting Divide in the Pathfinder panel. Ungroup the components, delete the rectangle and place the cut out circle components onto inner and outer corners of the design (see below).
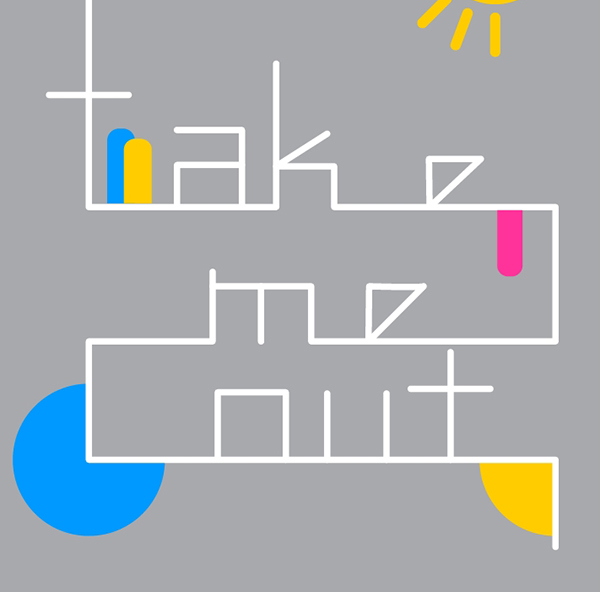
Step 11
Use the Polygon Tools to draw overlapping triangles on the left side of the design. Scatter white circles around the design with the Ellipse Tool.

Step 12
Let’s focus on the top of the design. Add circles and rounded rectangles to the clouds or around the clouds in blue and white. I’m loving how these infographic vector elements are turning out!

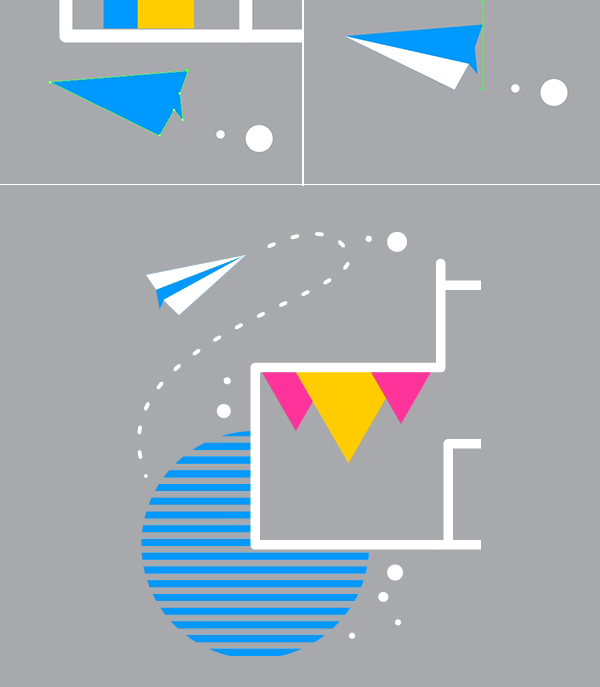
Step 13
Two triangles United in the Pathfinder panel make a quick and easy paper airplane. Draw two white triangles over the top and bottom of it to denote the planes of the paper. A path with a dashed stroke applied in the Stroke panel is a whimsical way of showing the paper airplane’s path. Also note the circle is now a pattern of gray and blue lines.
Step 14
What other unique infographic vector elements can you create? How about flowers! Three teardrop shapes form the pointed petals of tulips while an ellipse forms the bottom of the flower. To draw teardrops, draw a circle and pull the top anchor point upward with the Direct Selection Tool. Then convert the anchor point handles to a point rather than a curve. Draw a thin rectangle for the stem of the flower and a couple teardrops for the leaves. Add circles and rectangles to other elements within the design, like the yellow circle quarter.
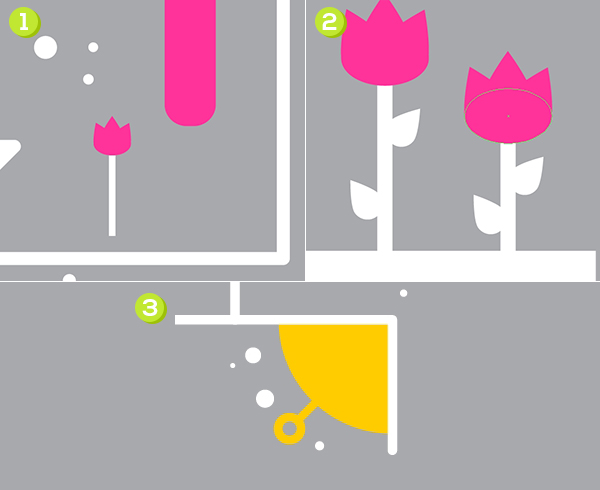
Step 15
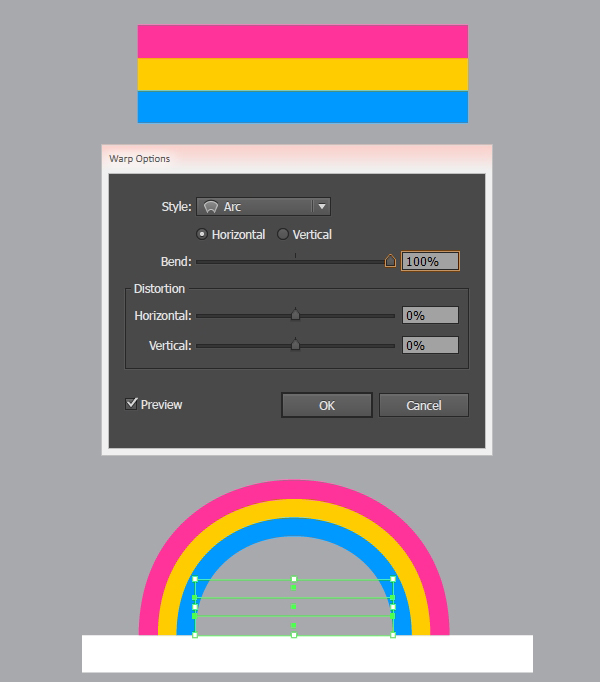
To create a rainbow, draw three identical rectangles in magenta, yellow, and blue.
Select all three rectangles and apply an Arc (Effect > Warp > Arc) with a 100% Horizontal Bend. Expand the rainbow shape and place around the composition as you like.
Step 16
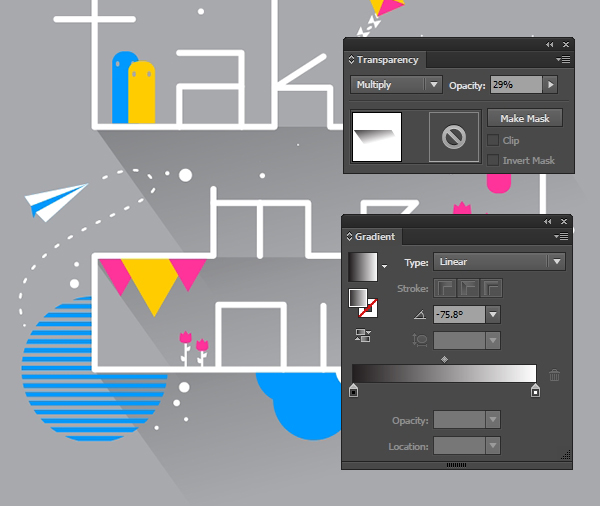
As a final touch, draw angled rectangles (or paralellograms) beneath each line of text containing a simple black to white linear gradient. Set the gradient’s angle to -75.8° in the Gradient panel. In theTransparency panel, set the gradient shapes to Multiply and the Opacity to 29%.
Conclusion: Trendy Infographic Vector Elements & Poster
Add additional simple infographic vector elements to your design. Kites, flowers, silly monsters; it’s all welcome to such a poster design. What other color schemes can you create? How about various phrases? Share your creations with us in the comment section below!
Author: Mary Winkler
Mary works under the brand Acrylicana® designing apparel, jewelry, and illustrating for companies like Disney, Jakks Pacific, Envato, and more. Check out Acrylicana.com for more artwork, tutorials, and more.


Very good blog.Much thanks again. Awesome.
Great to come to your site as the information shared is good and is explained in simple words. Good stuff you are created, thank you for sharing a nice article.
Excellent work my friend thanks for sharing