
Today you’ll find out how to create isometric vector infographic elements with the help of 3D effects. During our tutorial, we will create a Layer chart, Column and Pie graphs. Moreover, here I’ll tell you how to draw eight simple 3D isometric shapes. I hope this will help to expand your opportunities in creating isometric vector infographic elements. Let’s get started!


 In the following Easy Chart Vector tutorial you will learn how to create a simple line graph chart vector in Adobe Illustrator. In the first steps you will learn how to set up a simple grid and how to create the main shapes using basic tools and vector shapes building techniques. Next, you will learn how to ease your work using the Transform effect and how to add a bunch of text. Finally, you will learn how create a simple blend and how to take full advantage of the Appearance panel.
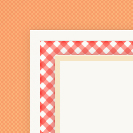 In the following tutorial you will learn how to create your own gingham pattern vector in Adobe Illustrator, and you’ll get some tips for using it. For starters you will learn how to set up a simple grid for your gingham pattern vector. Using this gingham pattern, a single rectangle and taking full advantage of the Appearance panel you will learn how to create a menu cover that you could edit and take in any direction.