
In today’s tutorial we will create 3D isometric infographic vector charts by using ‘2:1’ isometric projections. These types of projections are used in computer games for creation of locations. For automatization and acceleration of the process we will create three actions which will also be useful in future projects. Then we will use data for creation of flat chart with the help of the native Graphs Tool and finally we’ll create the final design. So, let’s get started!
Tutorial Details: Isometric Infographic Vectors in Near-Isometric 2:1 Projections
- Program: Adobe Illustrator CS5 – CC2014
- Difficulty: Beginner-Intermediate
- Topics Covered: Actions feature and Transform techniques
- Estimated Completion Time: 60 minutes
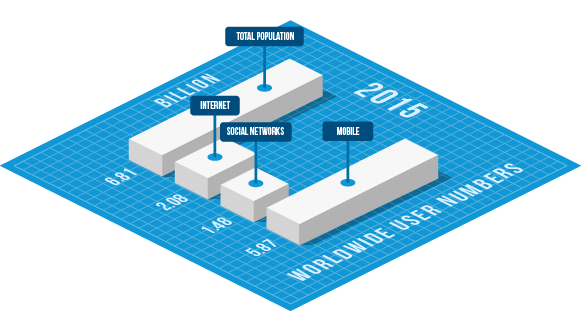
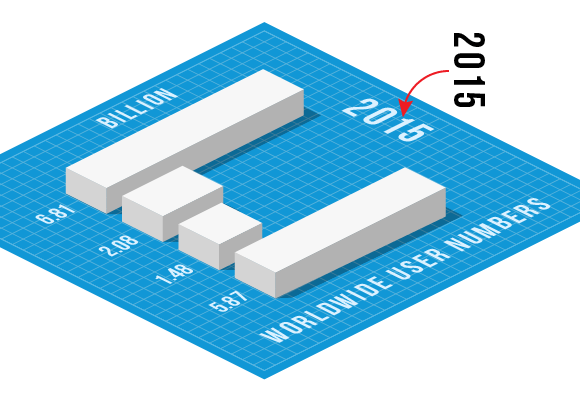
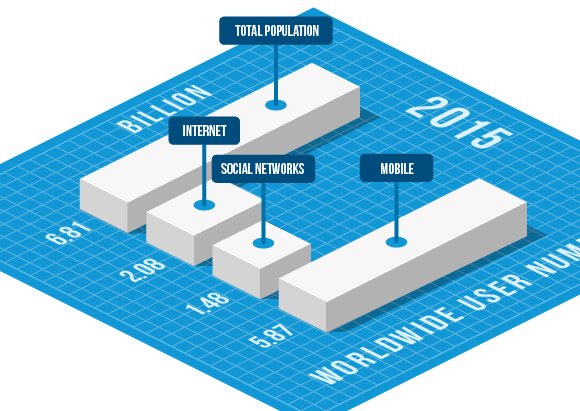
Final Image: Isometric Infographic Vectors
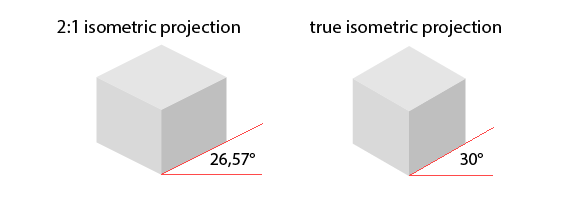
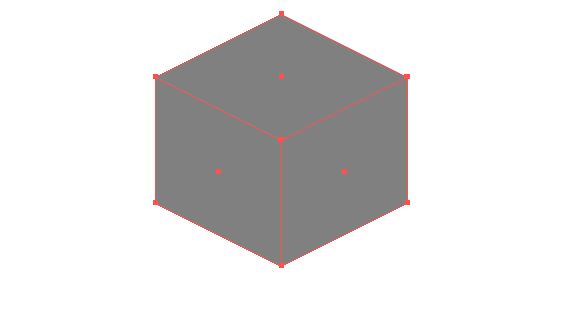
“True” isometric projection usually uses a 30º angle, but we will use a 26.565º angle. The majority of the isometric graphics these days use a variant of the isometric projection ‘2:1’. It was created in the time of pixel art and is used till today because a 30º angle might look too steep. I think that ‘true’ isometric projection suits better to technical drawing, whereas ‘2:1’ isometric projection is mostly used in design. For comparison, on the figure below you can see a cube in two types of isometric projections.
Step 1
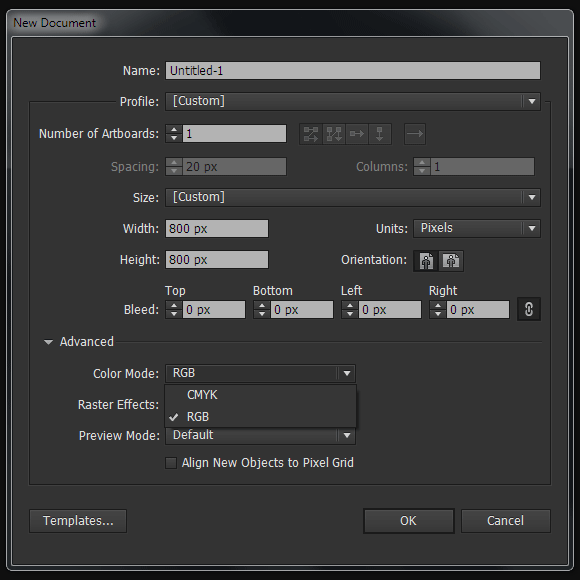
To begin this Isometric Infographic Vectors tutorial, open your Adobe Illustrator and create a new document (Cmd / Ctrl + N). Your artboard can be of any size. The isometric charts that we’ll create will work equally well in the RGB and in the CMYK color modes.
Action to Create Isometric Infographic Vectors
Step 2
Let’s create an action which will allow us to automize the creation process of isometric infographic vectors and projections, which will speed up our work today and in future projects drastically. Let’s draw three identical rectangles with the help of the Rectangle Tool (M) with a fill of any color.

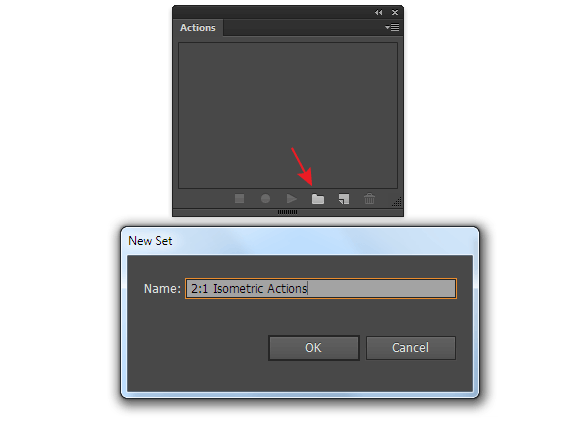
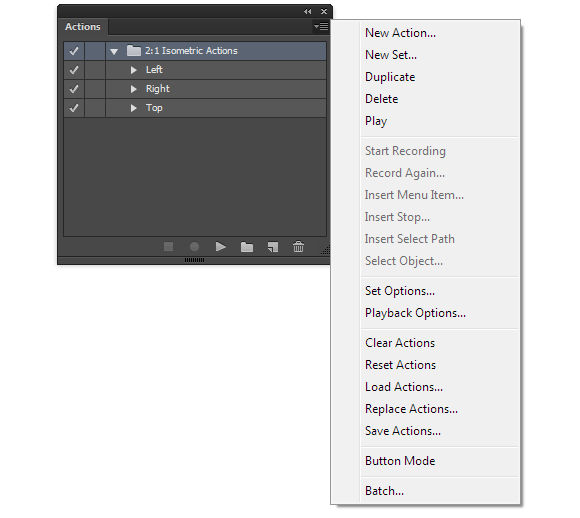
Open the Actions panel (Window > Actions) and create a new set, by pressing the corresponding button in the panel. Name this set, 2:1 Isometric Actions.
Step 3
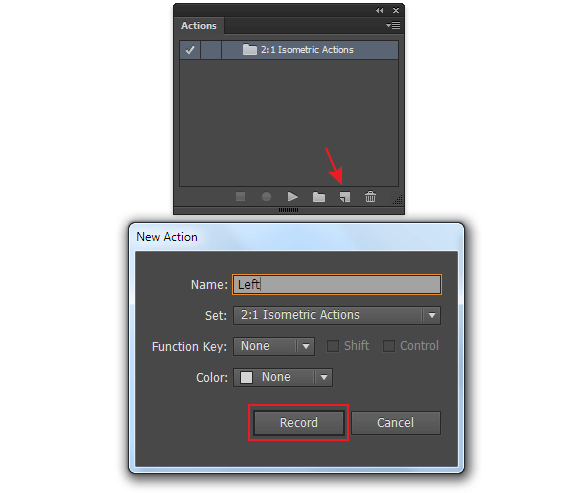
Click on the Create New Action button in the Actions panel and name it Left, then press the Record button.
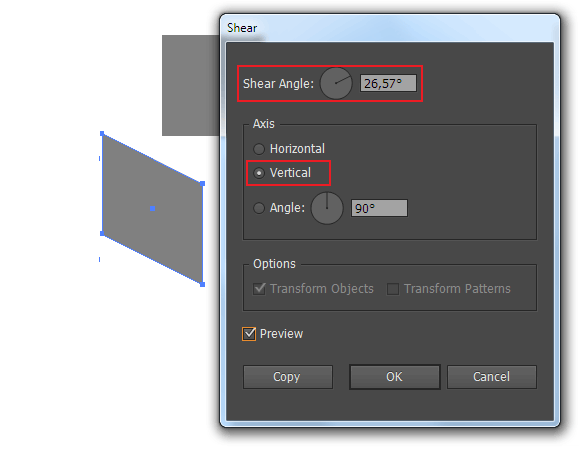
Select the left rectangle and go to the Object > Transform > Shear…, set the 26,57º angle and select Vertical option.
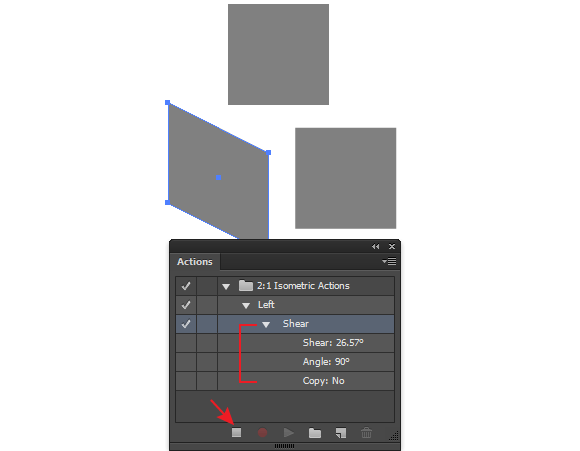
After we click OK, our actions will be recorded in the Action panel. Click on Stop button.
Step 4
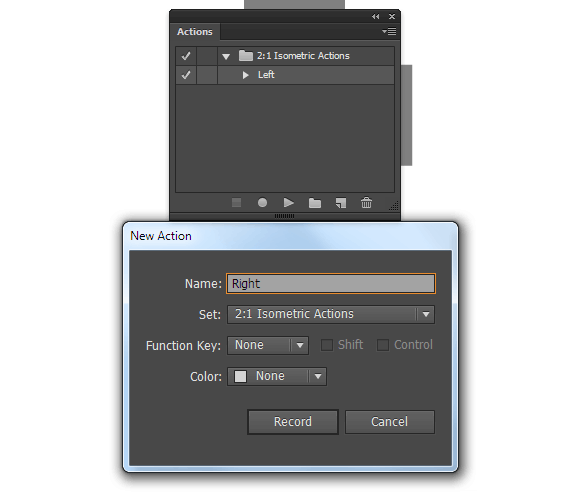
Click on the Create New Action button in the Actions panel and name it Right, then press the Record button.
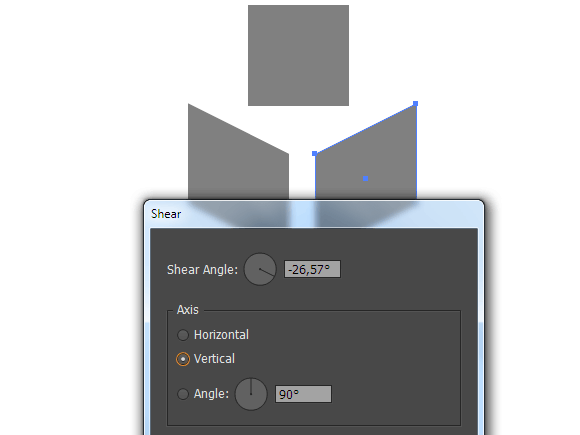
Select the right rectangle and go to the Object > Transform > Shear… and set -26,57º angle and select Vertical option.
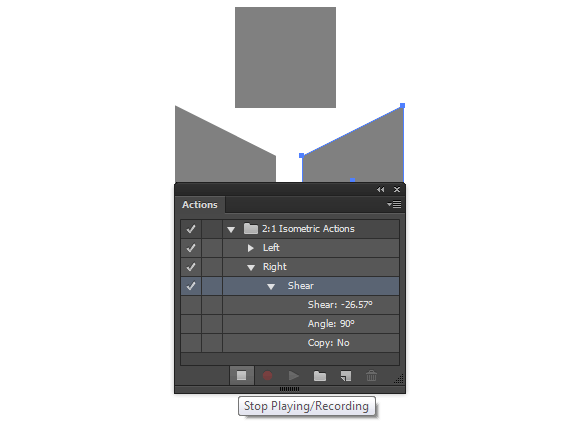
Click on Stop button in the Actions panel.
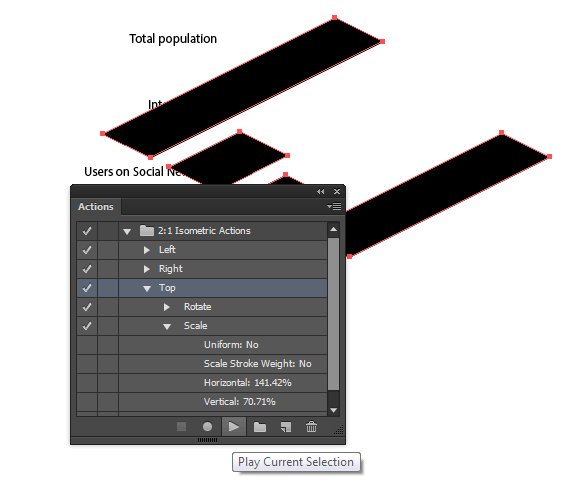
Step 5
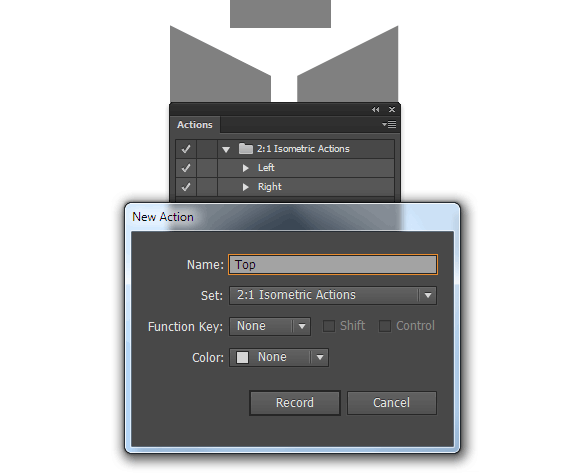
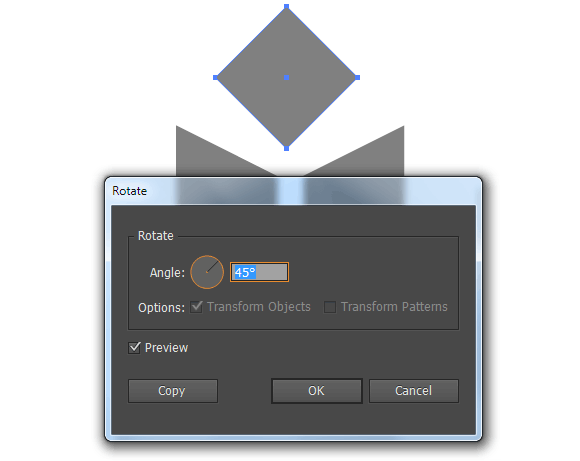
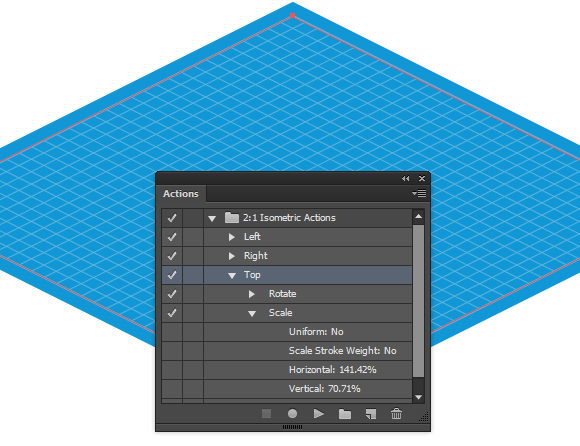
Click on the Create New Action button in the Actions panel and name it Top, then press the Record button.
Select the rectangle above and go to the Object > Transform > Rotate… and set 45º angle.
Step 6
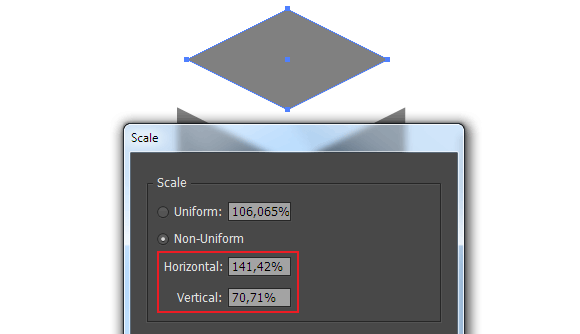
And now go to the Object > Transform > Scale… and set 141,42% for Horizontal option and 70,71% for Vertical option.
Click on the button Stop in the Actions panel.
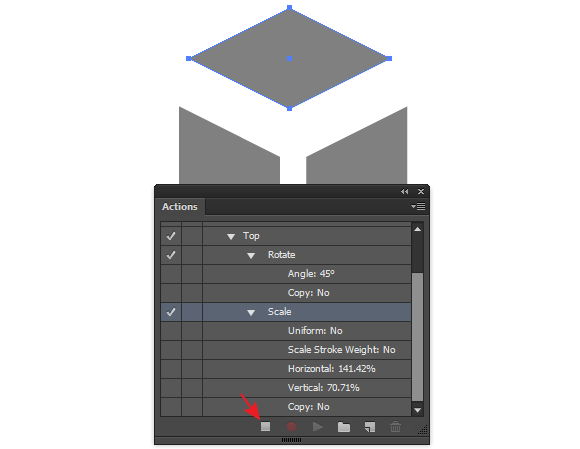
By aligning the received forms we can see that they match perfectly.
Step 7
Save Isometric Actions. To do this, choose Save Actions … in the fly-out menu of the Actions panel. Name this set ‘2_1 Isometric Actions’. Unfortunately, in recent releases of Adobe Illustrator (CS6-CC2014) some parameters may randomly disappear in the downloaded actions after restarting the application. If this happens, remove the actions in the Actions panel, and then load them again (select Load Actions … in the fly-out menu of the Actions panel).
Isometric Infographic Vectors Chart Creation
Step 8
Inforgraphics always involve work with data on the first stage. Take the Bar Graph Tool and create a marquee selection on the blank area of the current document. As the result of these actions, the Graph Data window opens, into which data and categories must be entered corresponding to them.
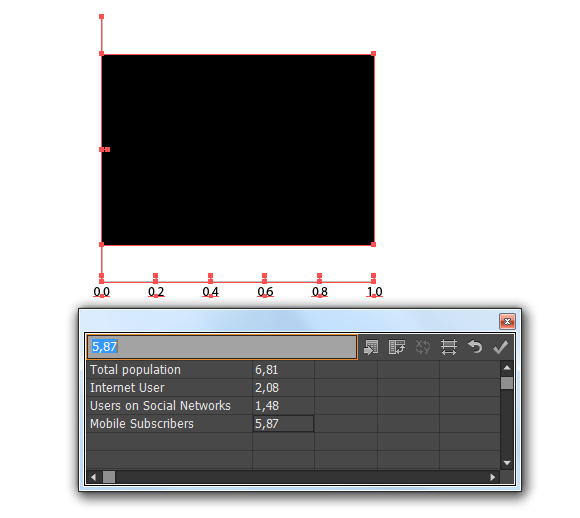
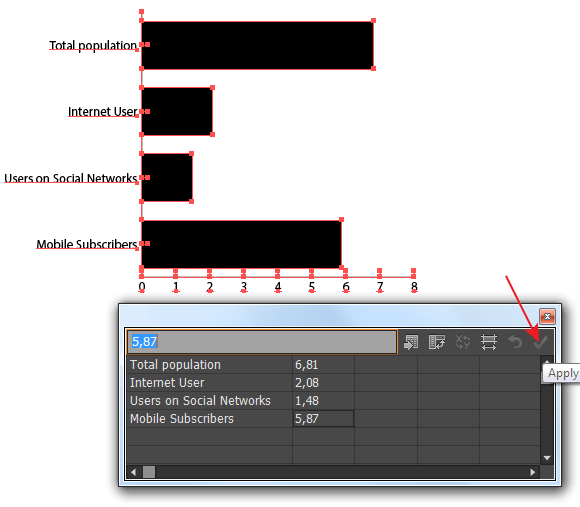
All the information is entered into the Entry text box. The selection of necessary cells of the table is performed with the help of the cursor. After entering the necessary information click on Apply in the Graph Data window, this will lead to graph creation.
Step 9
The object you created is dynamic, that means that you can always change the name, the sequence and number of categories and data. If you closed Graph Data window, to access your data go to the Object > Graph > Data…. You can change the type of chart after it is been created. To do this, go to the Object > Graph > Tape…
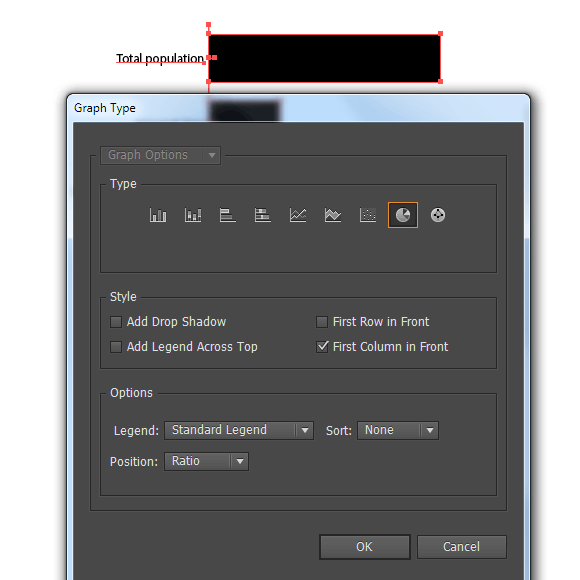
The chart will be changed only after you click the OK button.
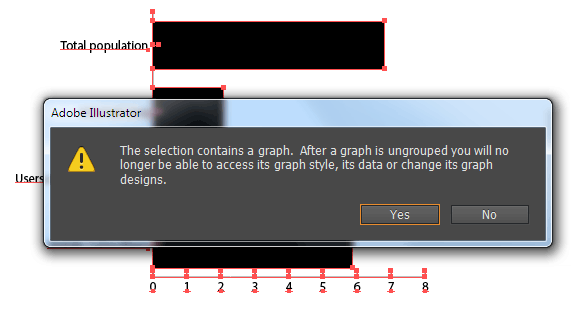
Step 10
Convert the dynamic chart into a group of regular vector objects. It can be performed by ungrouping Graph object (Shift + Cmd / Ctrl + G). When you lose the ability to control your data, the warning windows emerge.
Final Isometric Infographic Vectors Chart design
Step 11
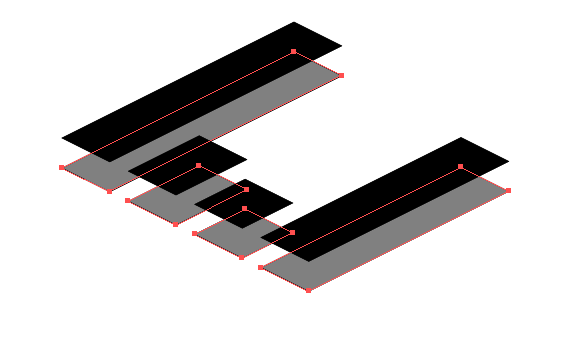
Delete the axis, select rectangles and turn off the stroke.

Now start Top action by clicking on the button Play in the Actions panel.
Copy the received objects and paste them back (Cmd/Ctrl + C; Cmd/Ctrl + B). Move the copies below by using the Down Arrow key. For your convenience recolor the copies into another color.
Step 12
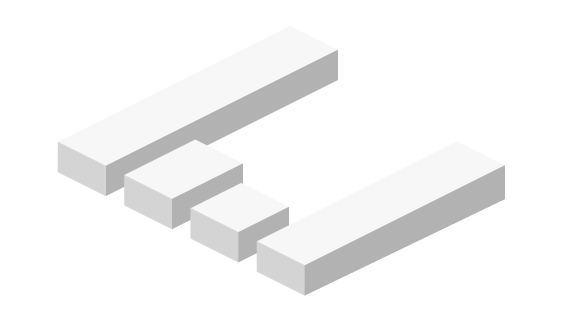
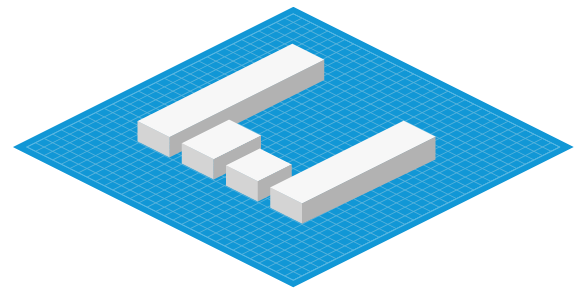
And now with the help of the Pen Tool (P) create the sides of parallelepipeds based on existing forms.
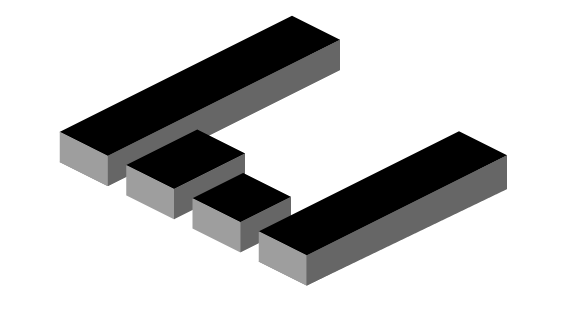
Color the sides into different shades of grey as it is indicated on the isometric infographic vector figure below.
Step 13
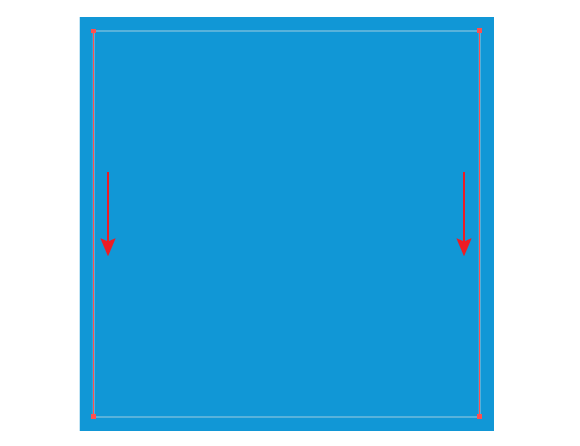
Create a square with light-blue fill and then create one more square with no fill and a bit lighter stroke. The size of the second square should be a little bit smaller than the first.

Take the Line Tool (\) and create two vertical linear segments. The direction of segments should be the same and the stroke should be the same as in the second square.
Step 14
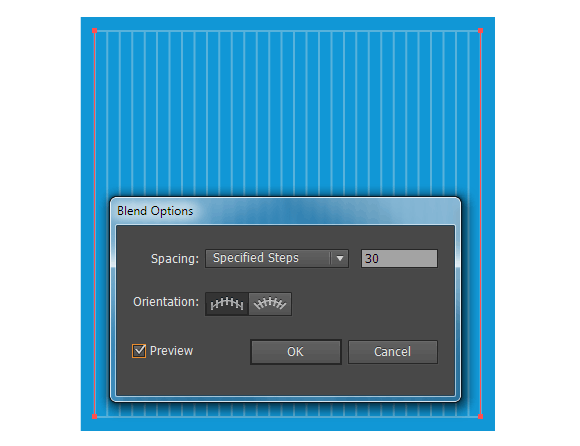
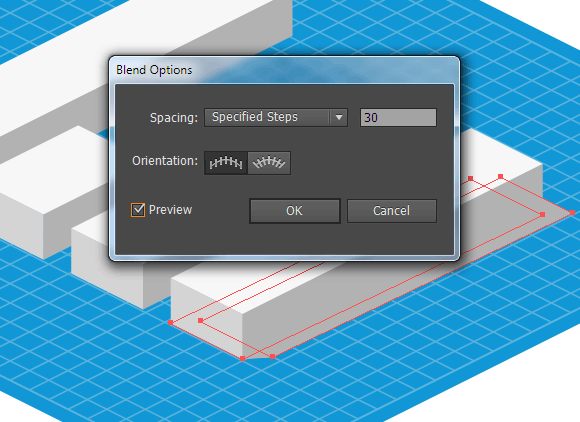
Select both linear segments, then go to the Object > Blend > Make. After it, go to the Object > Blend > Blend Options… and set 30 steps.
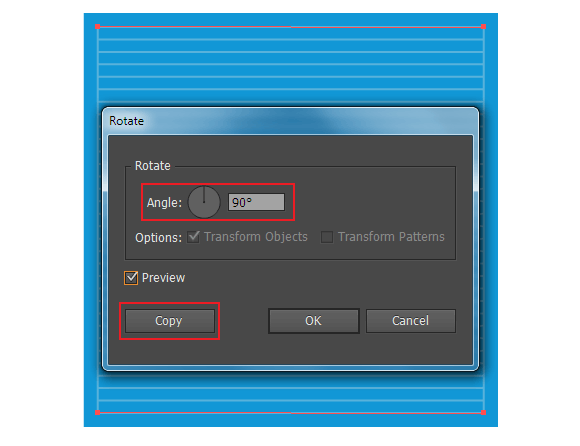
Keep the segments selected and go to the Object > Transform > Rotate… and set an angle of 90º then click Copy.
Step 15
Select both squares and two blend objects then start Top action in the Actions panel.
Place our isometric infographic vector chart above created plane.
Step 16
Double the lower side of one of the parallelograms, and then move the copy a little bit to the right.
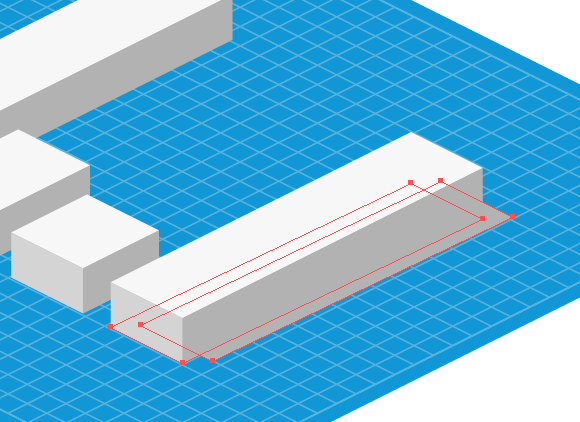
Select the lower side and the copy then Object > Blend > Make. After that go to the Object > Blend > Blend Options… and set 30 steps.
Step 17
Apply to the received blend object the Multiply blending mode. In such a way, we’ve created a drop shadow.
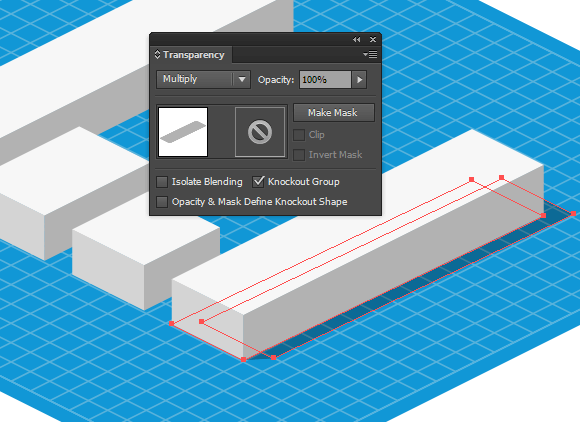
By using this technique create a shadow below the rest of the isometric infographic vectors.

Step 18
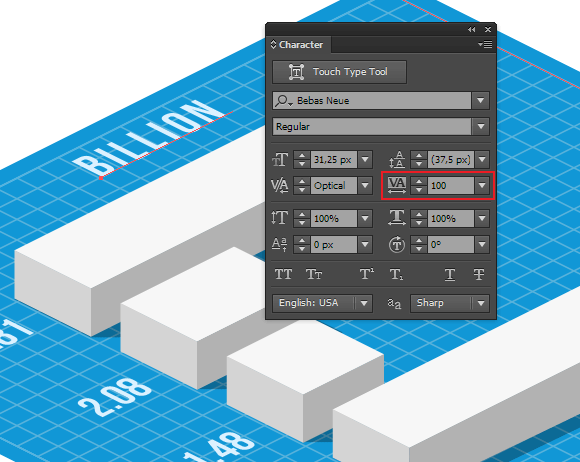
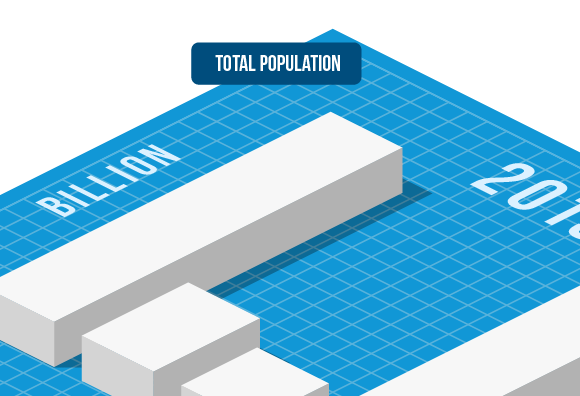
With the help of the Type Tool (T) type numerical data which corresponds to each column of the isometric infographic vectors. Then apply Top action to the text objects in order to correctly position the label in the plane. By the way, after these actions the text remains editable.
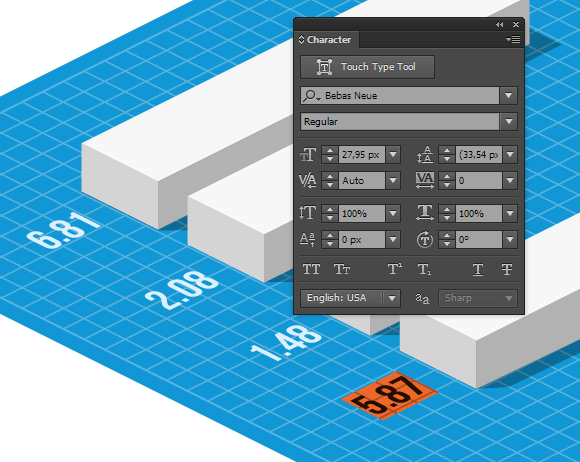
In some cases, after the text transformation into isometric plane, there will be very little space between its letters. In order to eliminate this shortcoming increase the Tracking value in the Character panel.
Step 19
And now create the name of the chart and indicate year. As you can see, the numbers of the year aren’t assigned with the direction of the rest of the text. In order to achieve this effect the inscription should be turned to 90 degrees clockwise before Top action is applied.
Step 20
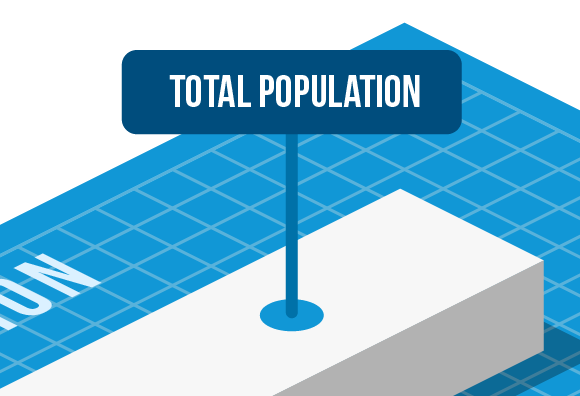
Type the name of the category and place the inscription on the rectangle with rounded angles.
Join the category with corresponding column of the chart with the help of straight line segment.
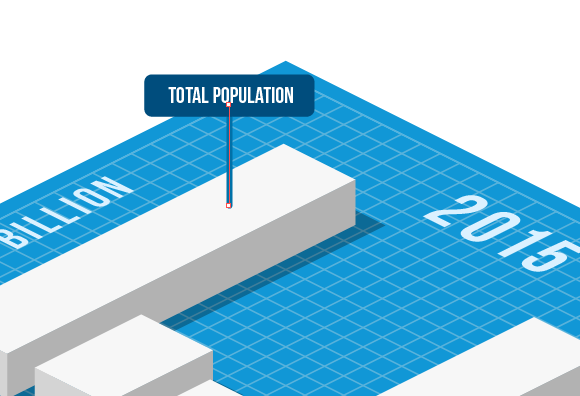
Create a circle with the help of the Ellipse Tool (L) then apply the Top action to it. Place the received ellipse below straight line segment.
Create categories above the remaining columns by analogy.
Step 21
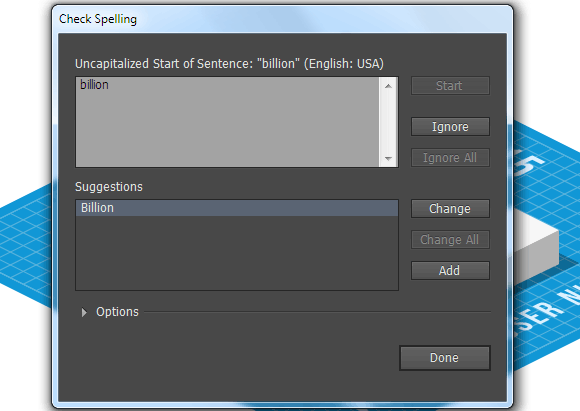
Infographics always contains text objects and that’s why I recommend checking your grammar, besides the fact that Adobe Illustrator performs it automatically. Make sure that all text objects are unblocked (Object > Unlock All), now go to Edit > Check Spelling…. Click Start in the dialog box. Here you’ll see all existing mistakes and the correct words will be offered for change.
Even though during this Isometric Infographic Vectors tutorial we used only one action from three created, but I’m sure all of them will be useful in your work. For example, to create charts, indicated on the figure below, you need to use Left and Right actions.

I hope you enjoyed this Isometric Infographic Vectors tutorial and you received a useful tool for 2:1 isometric projections creation.

Author: Iaroslav Lazunov
My name is Iaroslav Lazunov, I am a graphic designer from Ukraine. I am glad that I finally found a job in my life that I can share my knowledge and experiments with you in my tutorials. Follow me on Twitter or visit my blog Vectorboom.com


I want to point out my admiration for your kindness in support of individuals that really want assistance with that subject. Your very own dedication to getting the message all-around came to be rather valuable and have all the time empowered associates much like me to arrive at their desired goals. Your useful useful information implies a whole lot to me and somewhat more to my colleagues. Thanks a ton; from all of us.
Pretty nice post. I just stumbled upon your blog and wished to say that I have really enjoyed browsing your blog posts. After all I will be subscribing to your feed and I hope you write again soon!.
Really great tutorial. I’m curious, how did you get those values for scaling in Step 6? I also see that you have a #,#% for each value. What does the first number represent?
Thank you for the training you provided
THANK YOU!! been searching for that faux-iso 2:1 values whole afternoon, because normal isometry seemed too steep and finally found it.
dear Iaroslav Lazunov,
your tutorial has been very much useful.
Your effort is sharing the knowledge is laudable.
mahadeva sharma s