
 In the following Easy Chart Vector tutorial you will learn how to create a simple line graph chart vector in Adobe Illustrator. In the first steps you will learn how to set up a simple grid and how to create the main shapes using basic tools and vector shapes building techniques. Next, you will learn how to ease your work using the Transform effect and how to add a bunch of text. Finally, you will learn how create a simple blend and how to take full advantage of the Appearance panel.
Tutorial Details: Easy Chart Vector
- Program: Adobe Illustrator CC
- Difficulty: Beginner-Intermediate
- Topics Covered: Basic Tools and Effects, Transform techniques and the Appearance panel
- Estimated Completion Time: 45 minutes
Final Image: Easy Chart Vector
As always, this is the final Easy Chart Vector image that we’ll be creating:

Step 1: Easy Chart Vector
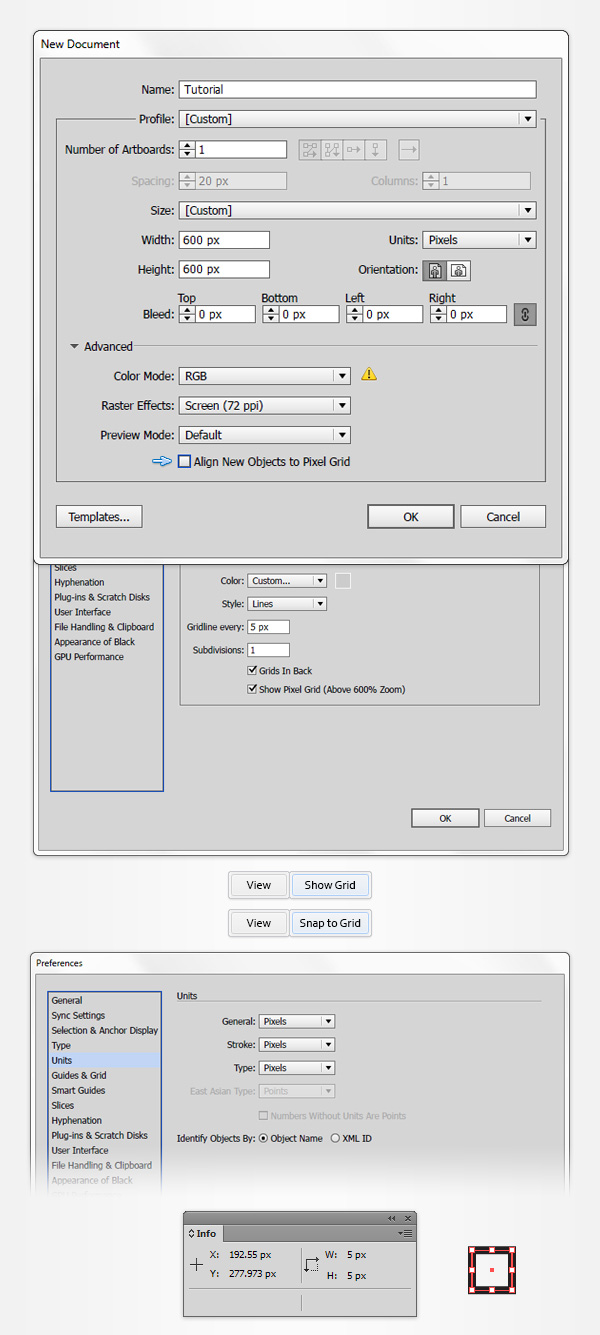
First off for this easy chart vector, hit Control + N to create a new document. Select Pixels from the Units drop-down menu, enter 600 in the width and height boxes and then click on the Advanced button. Select RGB, Screen (72ppi) and make sure that the Align New Objects to Pixel Grid box is unchecked before you click OK.
Enable the Grid (View > Show Grid) and the Snap to Grid (View > Snap to Grid). You will need a grid every 5px, so simply go to Edit > Preferences > Guides > Grid, enter 5 in the Gridline every box and 1 in the Subdivisions box. Try not to get discouraged by all that grid, it will ease your work and keep in mind that you can easily enable or disable it using the Control + “ keyboard shortcut.
You should also open the Info panel (Window > Info) for a live preview with the size and position of your shapes. Do not forget to set the unit of measurement to pixels from Edit > Preferences > Units > General. All these options will significantly increase your work speed.
Step 2
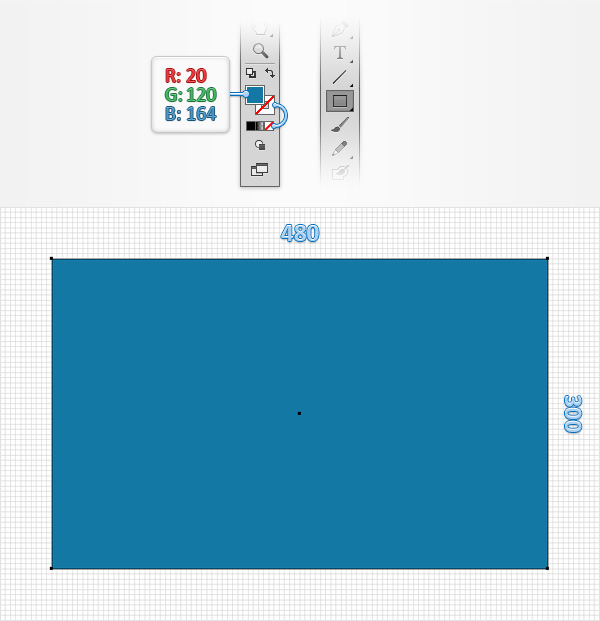
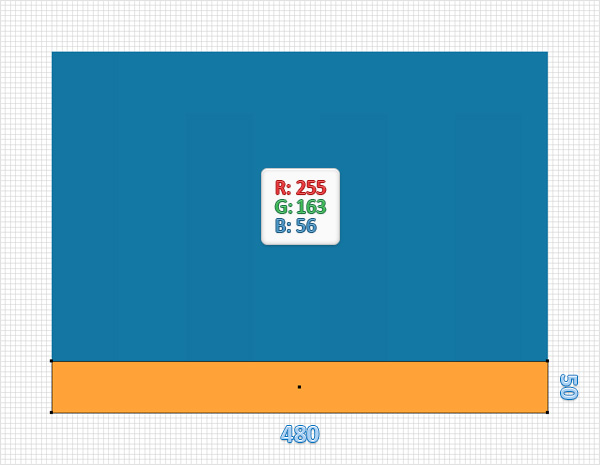
Pick the Rectangle Tool (M) and focus on your Toolbar. Remove the color from the stroke then select the fill and set its color at R=20 G=120 B=164. Move to your artboard and simply create a 480 x 300 px rectangle, the grid and the Snap to Grid feature should ease your work.
Step 3
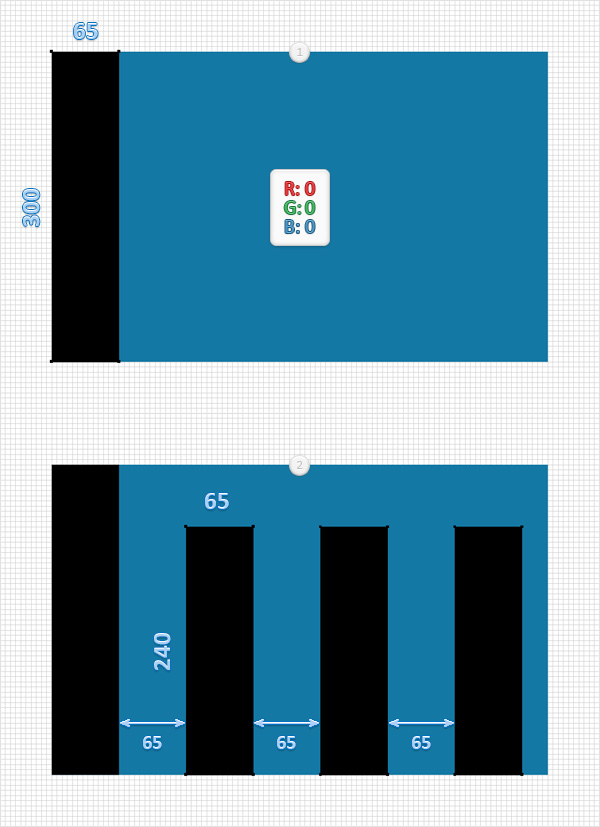
Return to your Toolbar and replace the existing fill color with a simple black (R=0 G=0 B=0). Make sure that the Rectangle Tool (M) is still active, create a 65 x 300 px shape and place it exactly as shown in the first image. Using the same tool, create three, 65 x 240 px shape and place them exactly as shown in the second image. Once again, the grid and the Snap to Grid feature will come in handy.
Step 4
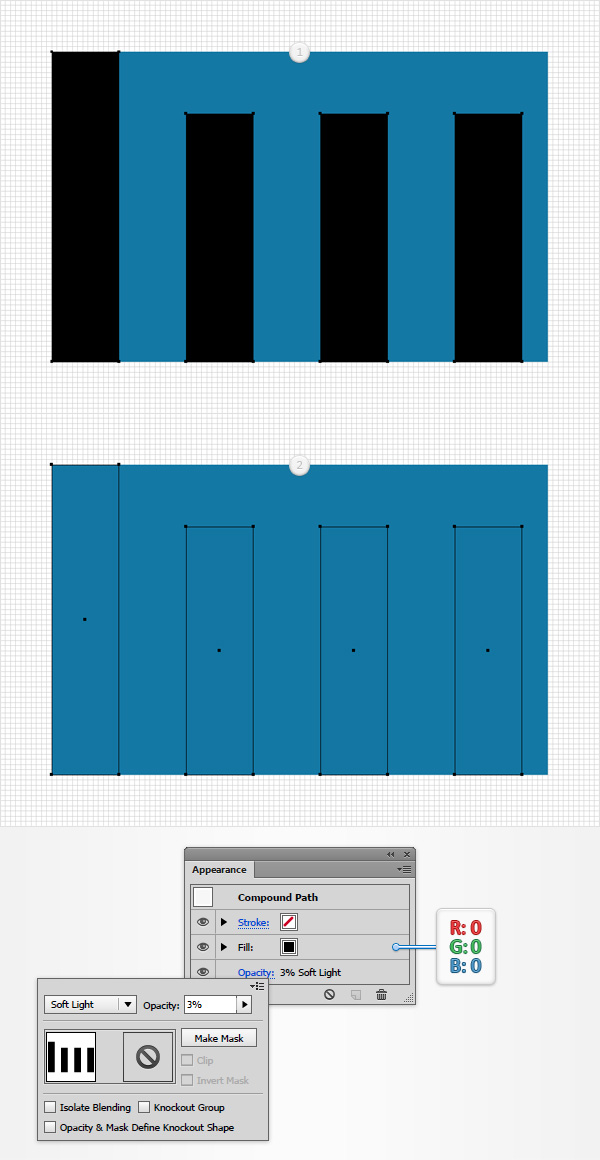
Reselect your four, black rectangles and simply hit Control + 8 (or go to Object > Compound Path > Make) to turn them into a simple compound path. Make sure that this new compound path stays selected, focus on the Appearance panel (Window > Appearance) and click that “Opacity” piece of text to open the Transparency fly-out panel. Change the Blending Mode to Soft Light and lower the Opacity to 3%.
Step 5
Using the Rectangle Tool (M), create a 480 x 50 px shape, place it right below your blue rectangle and set the fill color at R=255 G=163 B=56.
Step 6
Disable the Snap to Grid (Shift + Control + “) and then go to Edit > Preferences > General and make sure that the Keyboard Increment is set at 1 px.
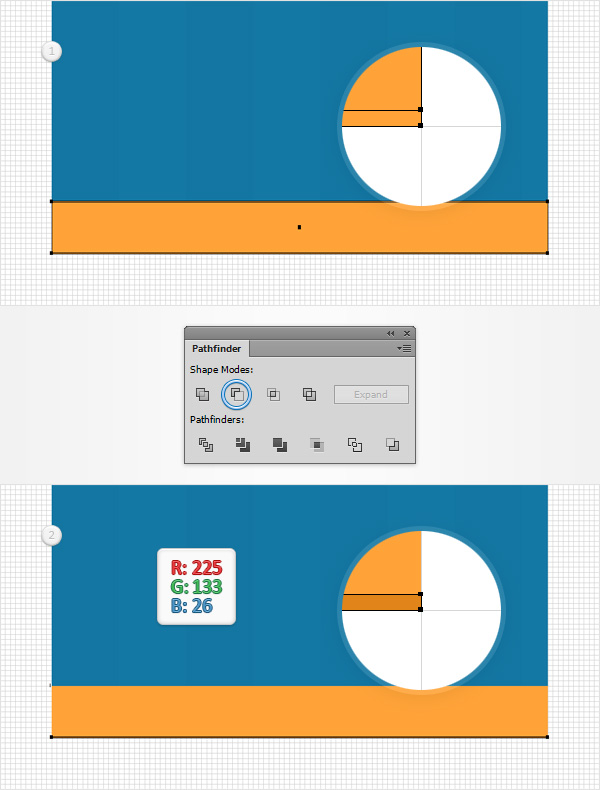
Make sure that your orange rectangle is selected and make two copies in front (Control + C > Control + F > Control + F). Select the top copy and move it 1 px up using the up arrow button from your keyboard. Reselect both shapes made in this step, open the Pathfinder panel (Window > Pathfinder) and click the Minus Front button. Make sure that the resulting shape stays selected and replace the existing fill color with R=225 G=133 B=26.
Step 7
Next for this easy chart vector, enable the Snap to Grid (Control + ‘).
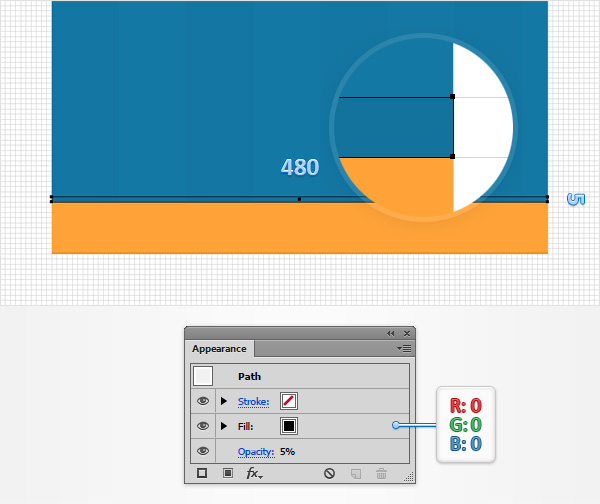
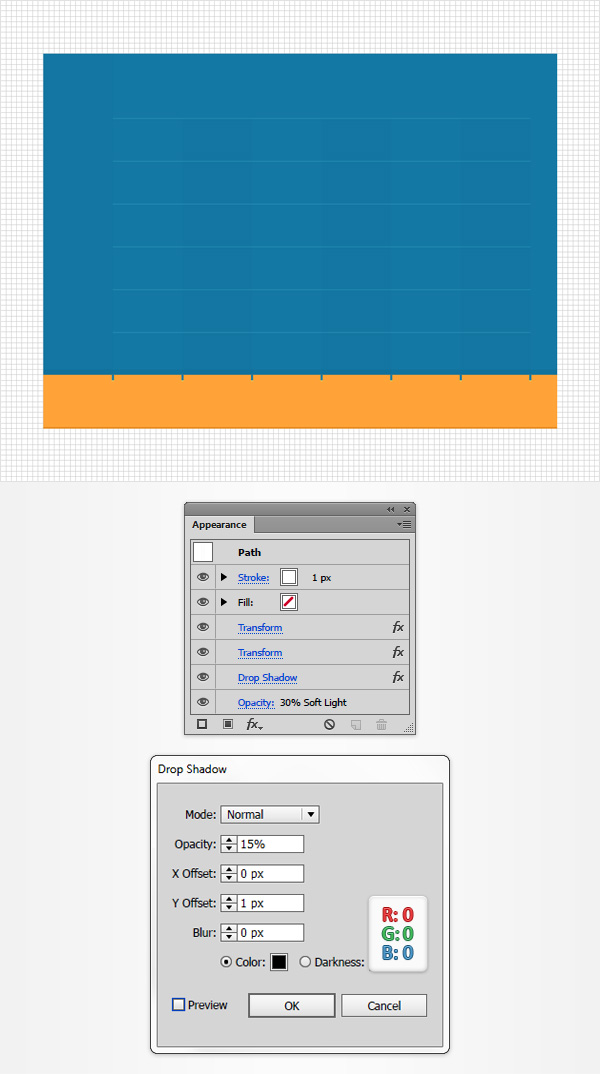
Using the Rectangle Tool (M), create a 480 x 5 px shape, make it black, place it as shown in the following image and don’t forget to lower its Opacity to 5 %.
Step 8
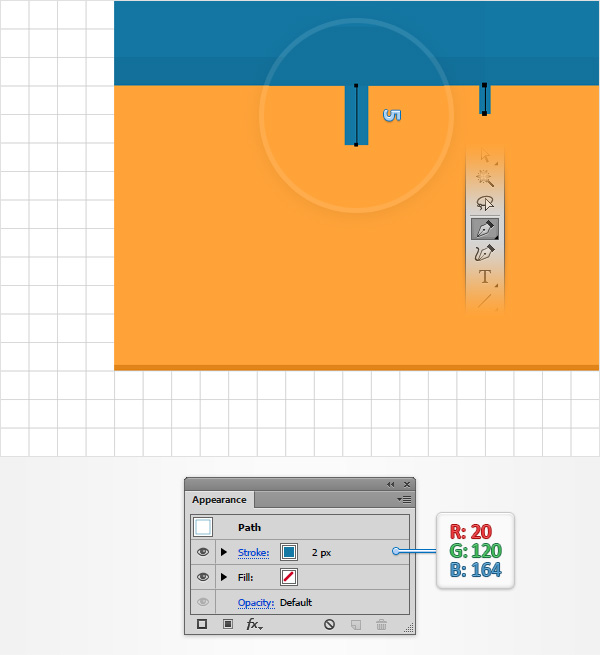
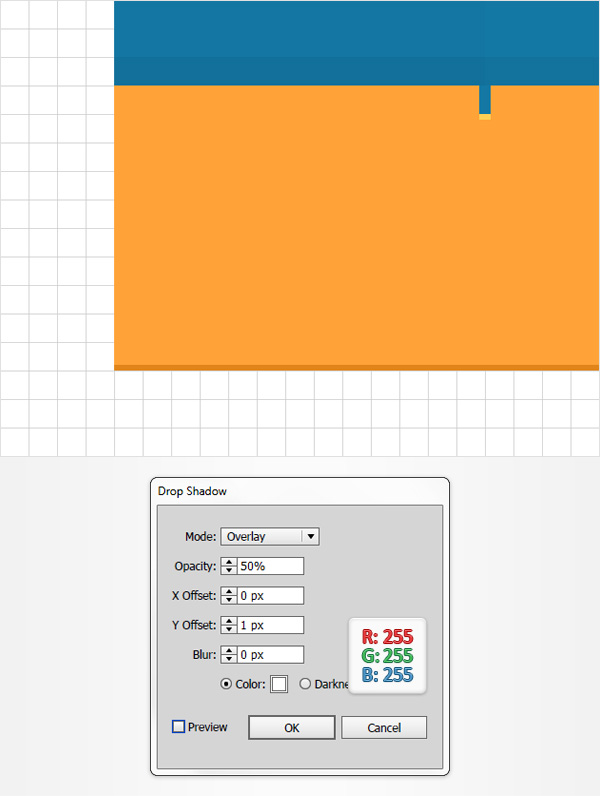
Using the Pen Tool (P), create a 5 px, vertical path and place it exactly as shown in the following image. Make sure that this tiny, new path stays selected and focus on the Appearance panel. Make sure that there’s no color set for the fill and then select the stroke. Use R=20 G=120 B=164 for the color and increase the Weight to 2 px.
Step 9
Make sure that your tiny, vertical path stays selected and go to Effect > Stylize > Drop Shadow. Enter the attributes shown in the following image and click the OK button.
Step 10
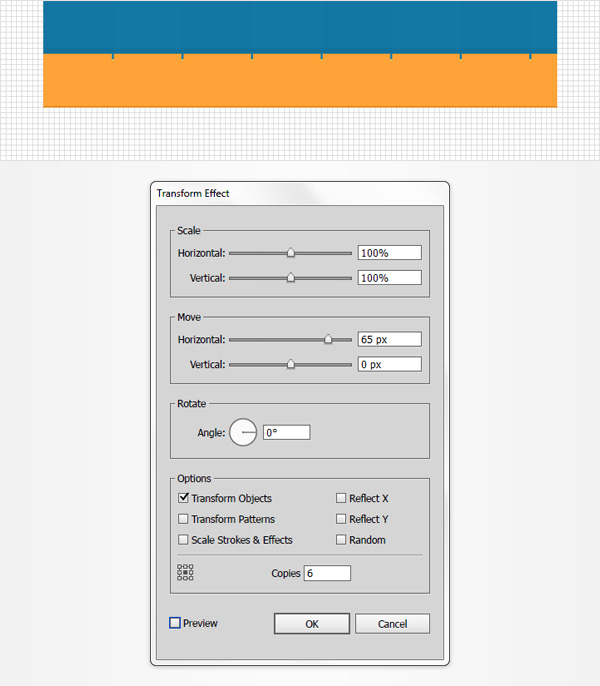
Make sure that your tiny, vertical path is still selected and go to Effect > Distort & Transform > Transform. Drag the Move-Horizontal slider at 65 px, enter 6 in the Copies box and then click the OK button.
Step 11
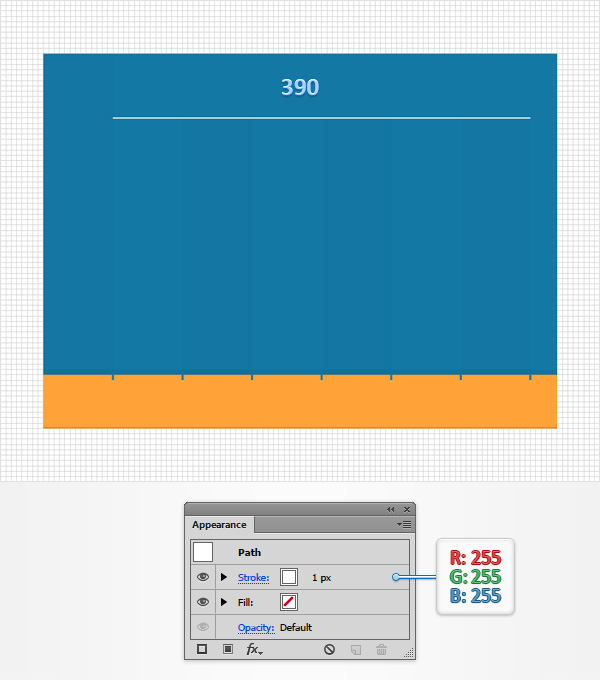
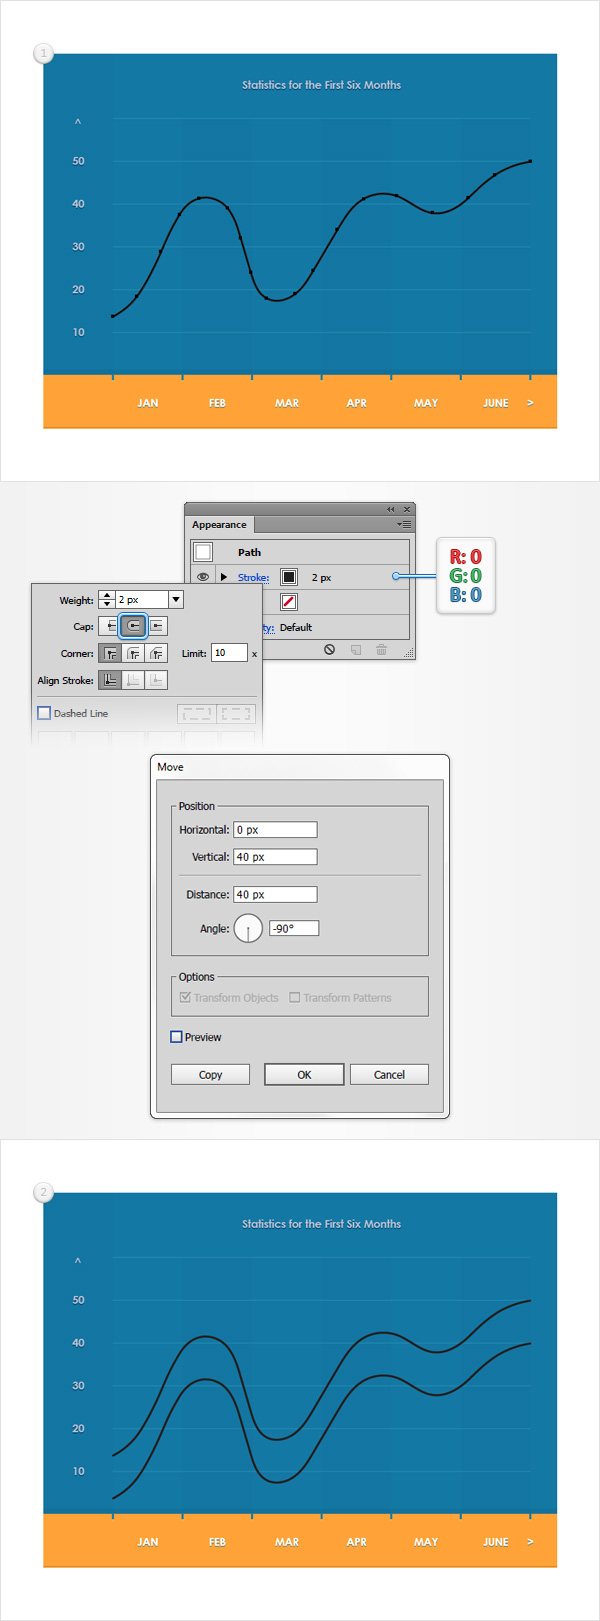
Using the Pen Tool (P), create a 390 px, horizontal path and place it exactly as shown in my easy chart vector image below. Make sure that this new path stays selected and focus on the Appearance panel. Again, make sure that there’s no color set for the fill and then select the stroke and set the color at white (R=255 G=255 B=255).
Step 12
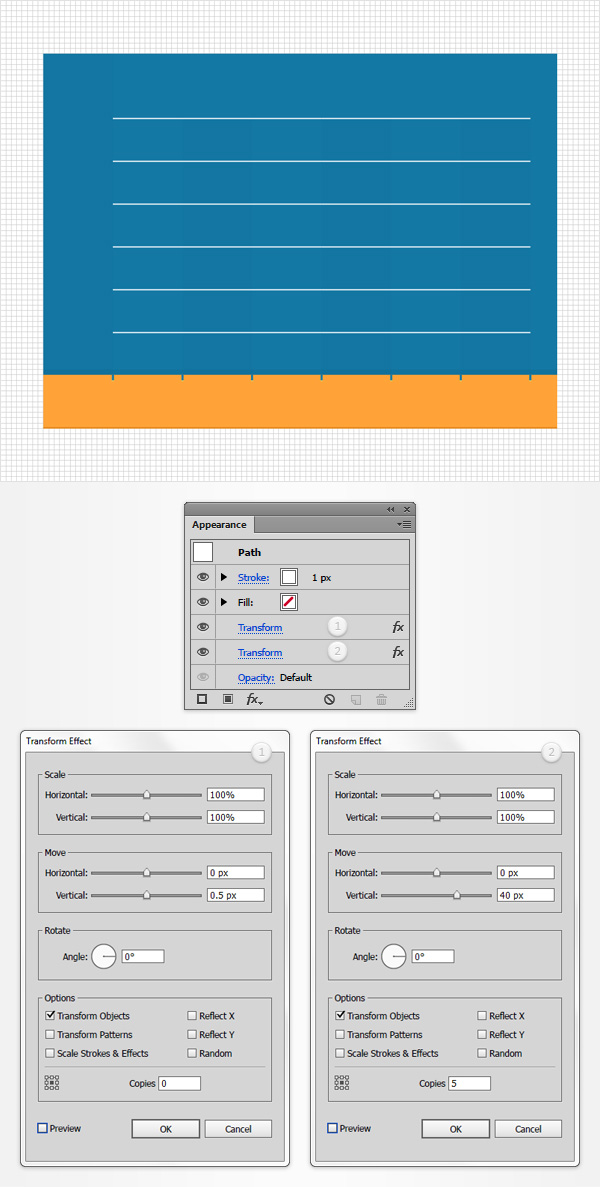
Make sure that your horizontal, white path stays selected and go to Effect > Distort & Transform > Transform. Drag the Move-Vertical slider at 0.5 px, click OK and then go again to Effect > Distort & Transform > Transform. Drag the Move-Vertical slider at 40 px, enter 5 in the Copies box and then click the OK button.
Step 13
Make sure that your horizontal, white path is still selected and focus on the Appearance panel. Lower the Opacity to 30%, change the Blending Mode to Soft Light and then go to Effect > Stylize > Drop Shadow. Enter the attributes shown in the following image and then click the OK button.
Step 14
Disable the Snap to Grid (Control + ‘).
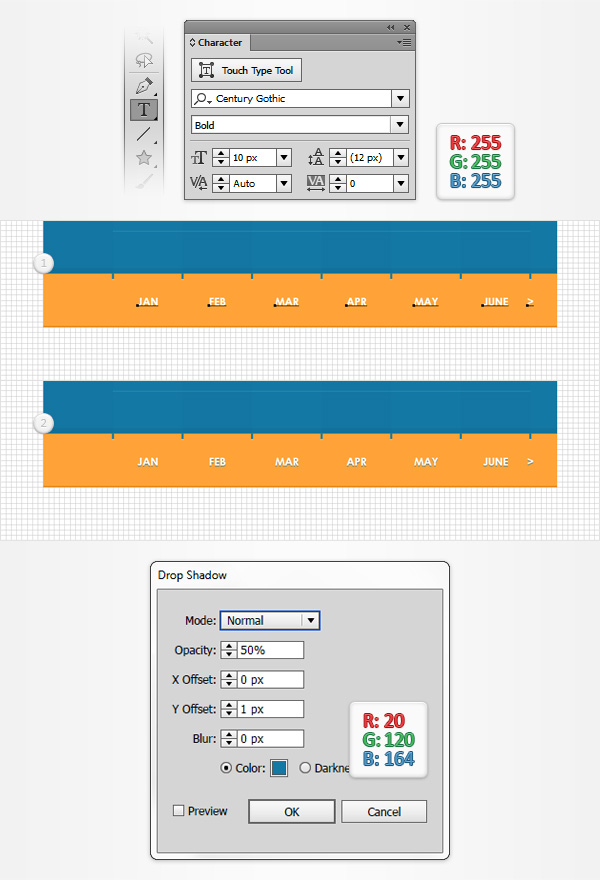
Using the Type Tool (T), add the pieces of text and the arrow shown in the following image. make it all white and then open the Character panel (Window > Type > Character) and use the attributes shown in the following image. Make sure that all these pieces of text are selected and go to Effect > Stylize > Drop Shadow. Enter the attributes shown in the following image and then click the OK button.
Step 15
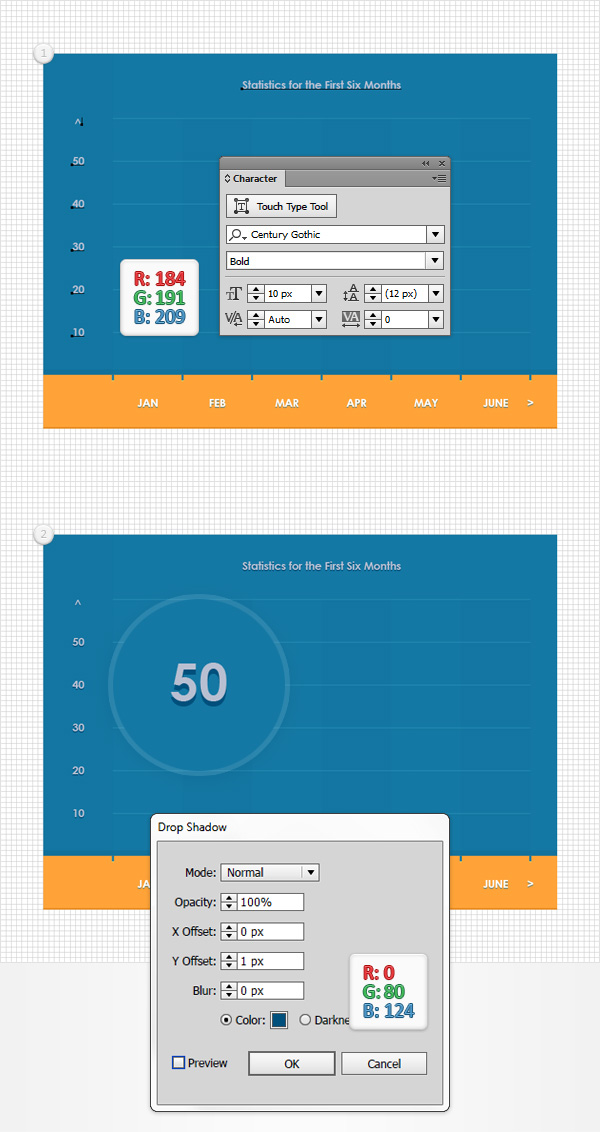
Using that same Type Tool (T), add the pieces of text and the arrow shown in the following image. Set the text color at R=184 G=191 B=144 and use the same font attributes. Make sure that all these new pieces of text are selected and go to Effect > Stylize > Drop Shadow. Enter the attributes shown in the following image and then click the OK button.
Step 16
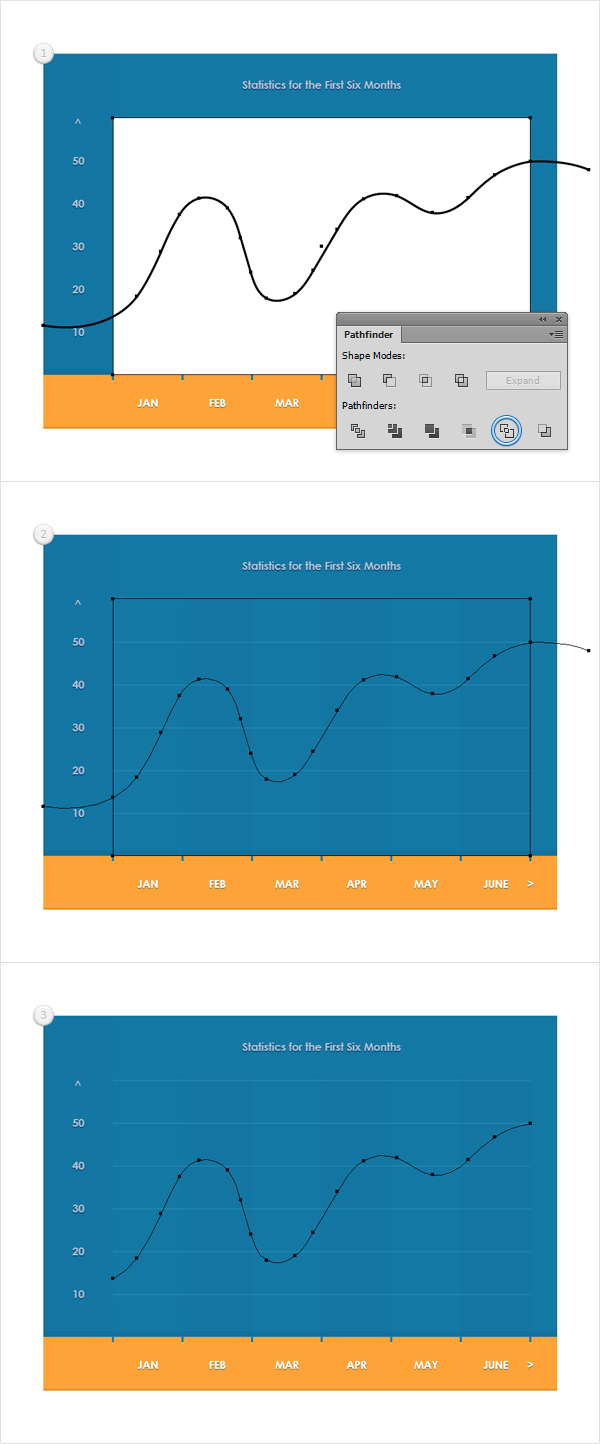
Enable the Snap to Grid (Control + ‘). Using the Rectangle Tool (M), create a 390 x 240 px shape, make it white and place it exactly as shown in the following image. Disable the Grid (Control + “) and the Snap to Grid (Shift + Control + ‘).
Using the Brush Tool (B), create a simple, wavy path as shown in the second image. Add a simple, black stroke for this new path and make sure that it doesn’t have a color set for the fill.

Step 17
Reselect the black path and the white rectangle made in the previous step and click the Outline button from the Pathfinder panel. Make sure that the resulting group of shapes is selected and simply hit Shift + Control + G to Ungroup it. Move to the Layers panel and focus on the paths made in the this step. Keep the wavy path highlighted in the third image and remove the rest of the paths.
Step 18
Make sure that your wavy path stays selected, focus on the Appearance panel and select the existing stroke. Make it black and then click that “Stroke” piece of text to open the Stroke fly-out panel. Increase the Weight to 2 px and then click that Round Cap button. Make sure that your wavy path is still selected and go to Object > Transform > Move. Enter 40 px in that Vertical box and then click the Copy button. In the end things should look like in the second image.
Step 19
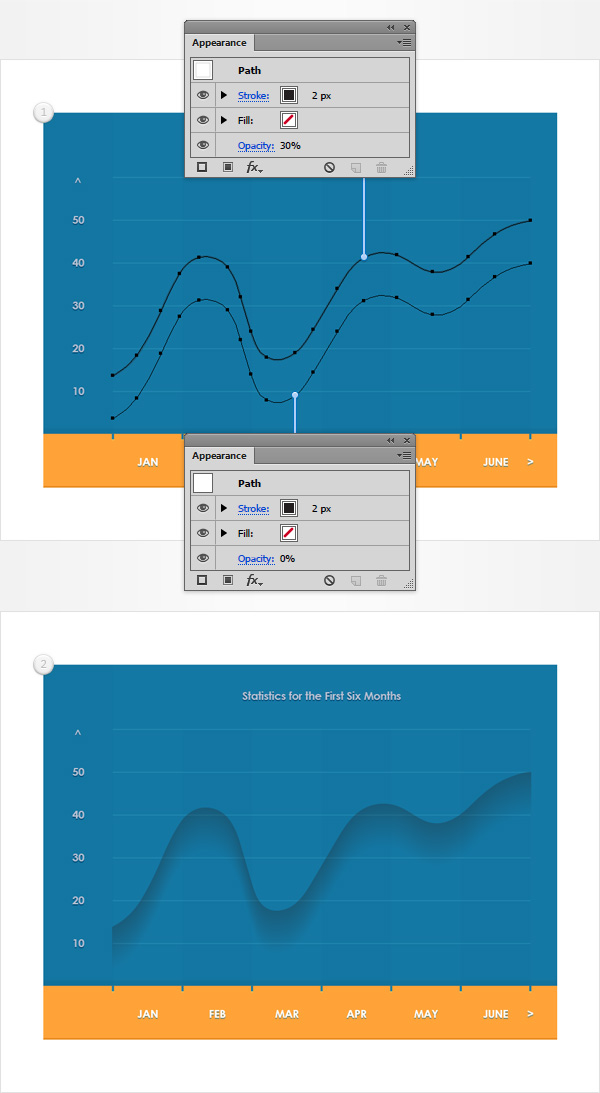
Keep focusing on your wavy paths in your easy chart vector. Select the top path and lower its Opacity to 30% and then select the bottom path and lower its Opacity to 0%. Focus on your Toolbar and simply double click on the Blend Tool to open the Blend Options window. Select Specified Steps from the Spacing drop-down menu and simply enter 50 in that white box. Reselect both wavy paths and simply hit Alt-Control-B to create a new blend. In the end things should look like in the second image.
Step 20
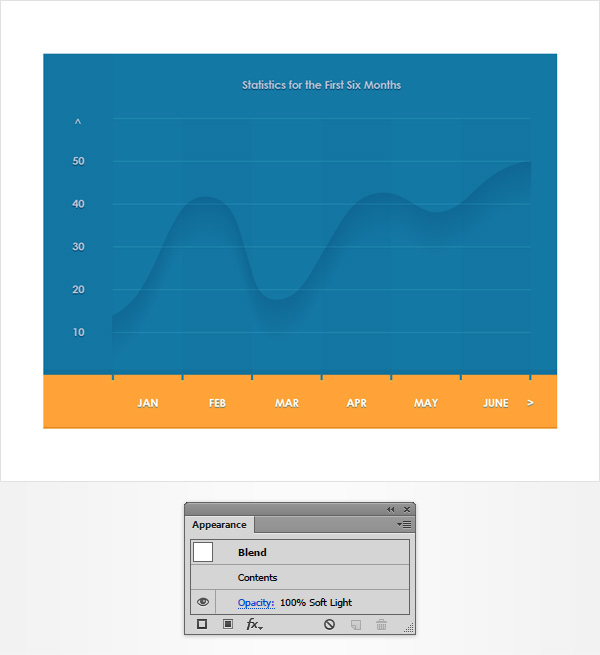
Make sure that your blend is still selected, focus on the Appearance panel and change the Blending Mode to Soft Light.
Step 21
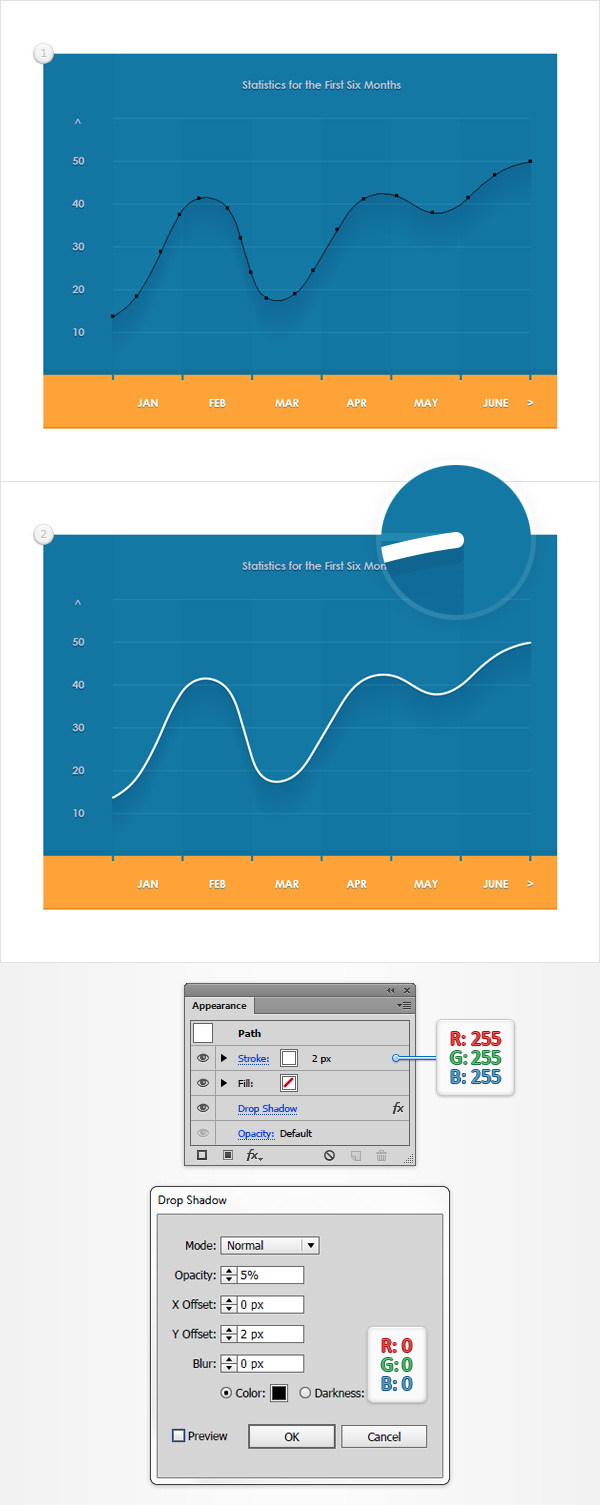
Focus on the Layers panel and open your blend. Select the top wavy path, make a copy in front (Control + C > Control + F) and drag it outside that blend, in the top of the Layers panel. Make sure that this new path stays selected and focus on the Appearance panel. Increase the Opacity to 100%, replace the existing stroke color with white and then go to Effect > Stylize > Drop Shadow. Enter the attributes shown in the following image and then click the OK button.
Step 22
Enable the Grid (Control + “) and the Snap to Grid (Shift + Control + ‘).
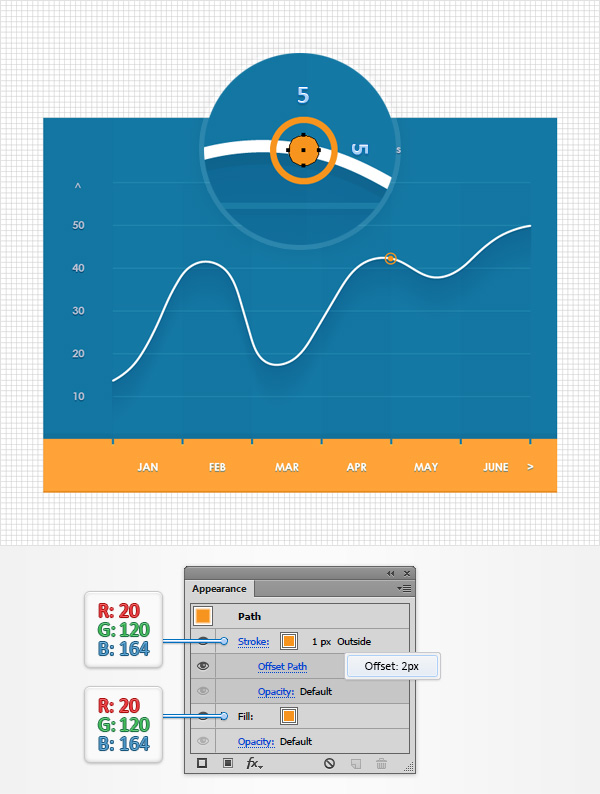
Using the Ellipse Tool (L), create a 5 px circle, set the fill color at R=20 G=120 B=164 and place it as shown in the following image. Make sure that this new shape stays selected and focus on the Appearance panel. Select the existing stroke, set the color at R=20 G=120 B=164, align it to outside and then go to Effect > Path > Offset Path. Enter a 2 px Offset and click OK.
Step 23
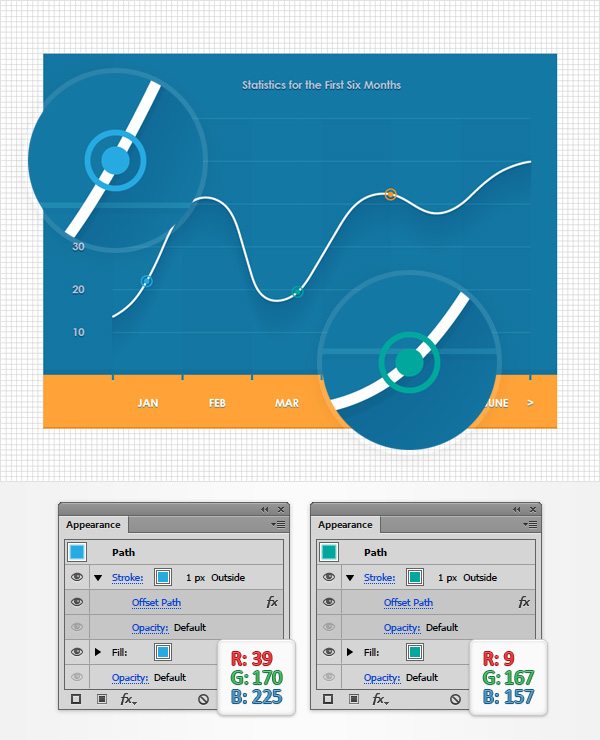
Multiply your 5 px circle (Control + C > Control + F) , spread the copies as shown below and replace the existing fill and stroke colors with the ones shown in the following image.
Step 24
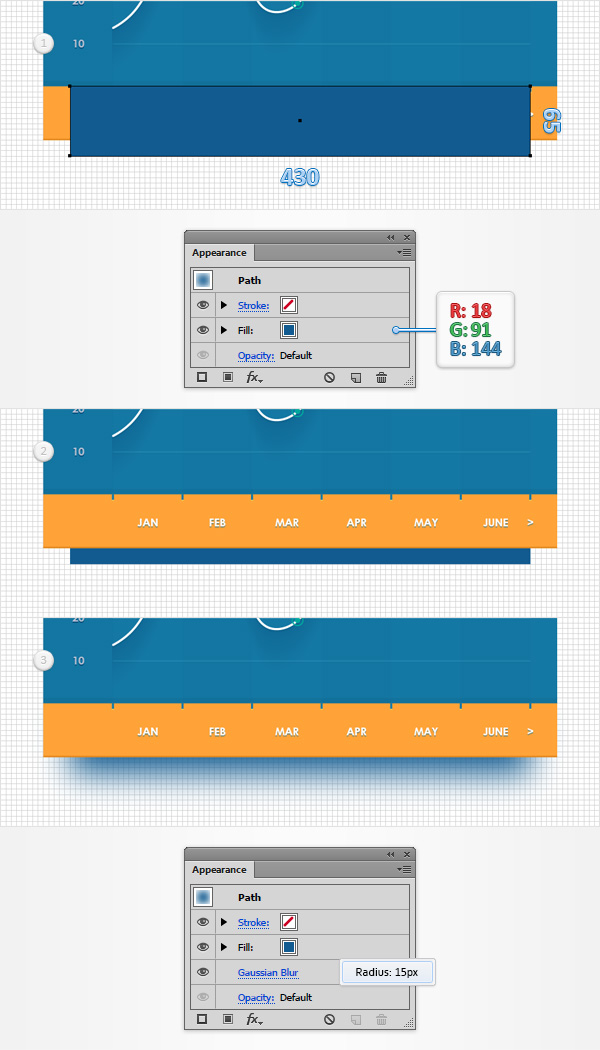
Using the Rectangle Tool (M), create a 430 x 65 px shape, set the fill color at R=18 G=91 B=144 and place it as shown in the first image. Make sure that this new rectangle stays selected, send it to back (Shift + Control + [ ) and then go to Effect > Blur > Gaussian Blur. Enter a 15 px Radius, click the OK button and you’re done.

Author: Andrei Marius
Andrei Marius is a self taught vector artist who is trying to make a living doing something that he likes. He spends most of his time working in Adobe Illustrator, trying to avoid the Pen Tool. You can find most of his vector experiments at this little website dedicate to Illustrator VforVectors.


Nice post. I find out some thing very complicated on distinct blogs everyday. It will always be stimulating to see content using their company writers and employ a little from their store. I’d would rather use some with all the content on my small weblog no matter whether you do not mind. Natually I’ll provide link for your internet weblog. Thank you for sharing.
Wow, marvelous blog layout! How long have you been blogging for? you make blogging look easy. The overall look of your site is great, as well as the content!
Only a few blogger would discuss this topic the way you do.’.”`:
Spot on with this write-up, I actually believe that this website needs far more attention. I’ll probably be returning to read through more, thanks for the info!
Hey, thanks for the article.Really thank you! Great.
I really liked your article.Really thank you! Awesome.
I am no longer sure where you are getting your info, but good topic. I must spend a while finding out more or understanding more. Thank you for wonderful info I was in search of this information for my mission.
Thank you for your article.Thanks Again. Awesome.
Muchos Gracias for your blog post.Really thank you!
Thank you ever so for you article. Awesome.
I appreciate you sharing this article.Really looking forward to read more. Will read on…
Hi there! I could have sworn I’ve visited this web site before but after looking at a few of the posts I realized it’s new to me. Anyhow, I’m certainly delighted I came across it and I’ll be bookmarking it and checking back often!
I am so grateful for your blog. Really looking forward to read more. Really Great!.
Im obliged for the blog. Awesome.
I truly appreciate this article post. Cool.
Thanks for sharing, this is a fantastic article.Really thank you! Really Cool.
Really appreciate you sharing this blog post.Thanks Again. Really Cool.
Hey, thanks for the blog article.Thanks Again. Fantastic.
Thank you ever so for you article post.Really thank you! Really Cool.
Really enjoyed this blog post. Great.
Great blog article.Much thanks again. Awesome.
Great, thanks for sharing this article.Really thank you! Keep writing.
Thanks for the auspicious writeup. It in fact was a amusement account it. Look complicated to more brought agreeable from you! By the way, how can we keep up a correspondence?
Really appreciate you sharing this article. Keep writing.
Great, thanks for sharing this blog post. Great.
Thanks I’m stuck on step 21
Thanks Andrei, nice tutorial with good explanation