

Today you’ll find out how to create isometric vector infographic elements with the help of 3D effects. During our tutorial, we will create a Layer chart, Column and Pie graphs. Moreover, here I’ll tell you how to draw eight simple 3D isometric shapes. I hope this will help to expand your opportunities in creating isometric vector infographic elements. Let’s get started!
Tutorial Details: Isometric Vector Infographic Elements
- Program: Adobe Illustrator CS5 – CC2014
- Difficulty:Intermediate
- Topics Covered: 3D effects
- Estimated Completion Time: 30 minutes
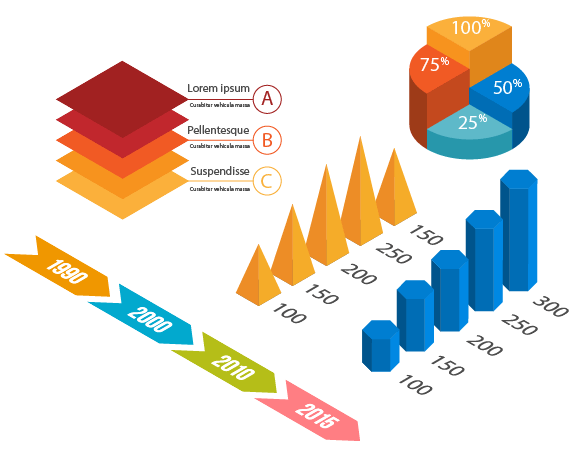
Final Image: Isometric Vector Infographic Elements
Step 1: Isometric Vector Infographic Elements
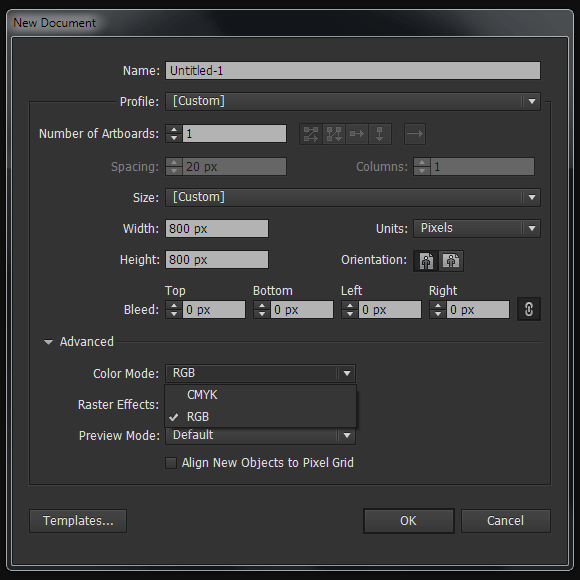
To begin this isometric vector info graphic elements tutorial open your Adobe Illustrator and create a new document (Cmd / Ctrl + N). Your artboard can be of any size. The isometric elements that we’re creating will work equally well in the RGB and in the CMYK color modes.
Step 2: Placing of flat objects into isometric planes.
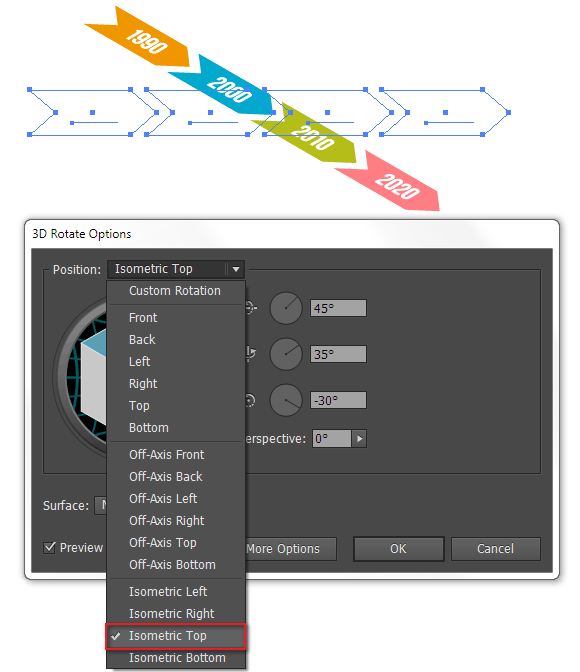
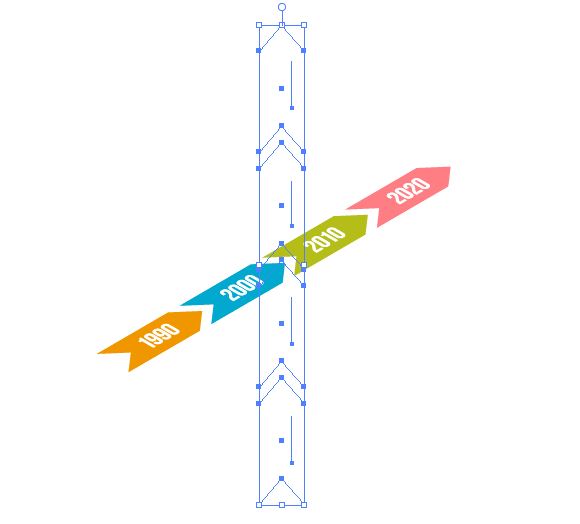
When working on isometric vector infographic elements we don’t only need to create 3D objects, but also place two-dimensional objects, such as text, icons and flat charts, into isometric planes. Let’s take a closer look at timeline example which is shown on the figure below.

Before you start working you may want to group all the objects of the element (Cmd/Ctrl + G). Select the timeline then go to the Effect > 3D > Rotate…. In the dialog box select one of the four isometric presets, Isometric Top for example.
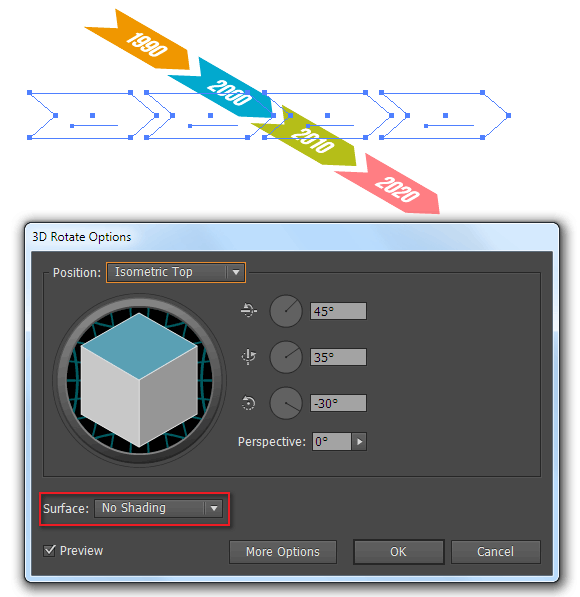
For Surface option select No Shading to make your timeline not change the color, click OK.
Step 3
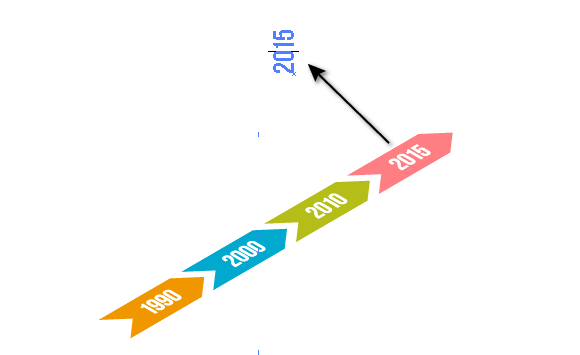
If you need to change the direction of your timeline, then turn it to 90 degrees.
By the way, our text remains editable.
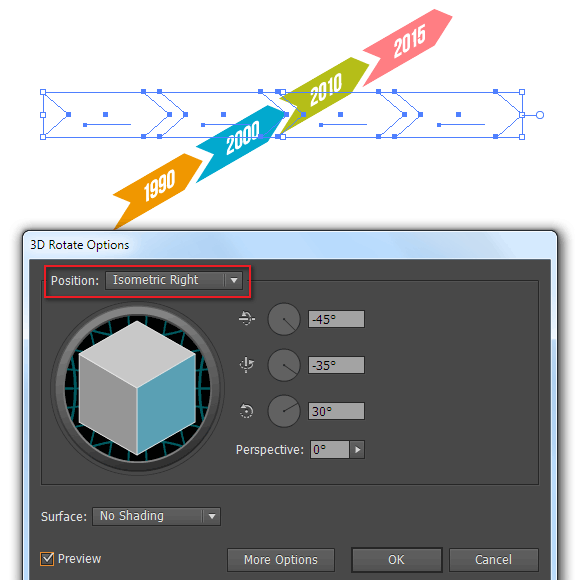
If you need to change the isometric plane, then click on 3DRotate link in the Appearance panel (Window > Appearance).
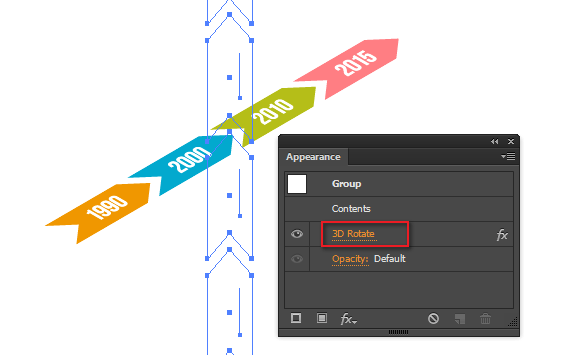
This opens the dialog box where you can select some different preset for isometrics.
Step 4
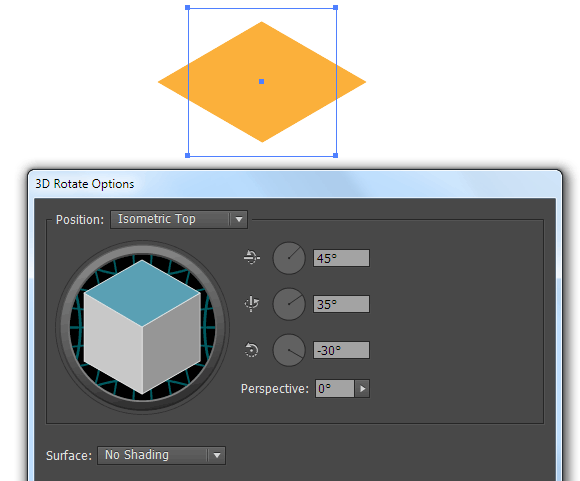
With the help of the Rotate effect we also can create layer chart. Draw a square with the help of the Rectangle Tool. Apply the 3D Rotate effect to it by selecting Isometric Top present in the dialog box.
Move the square up by holding down Shift and Opt/Alt keys which leads to its duplication.
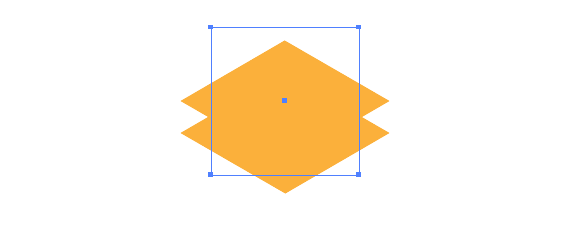
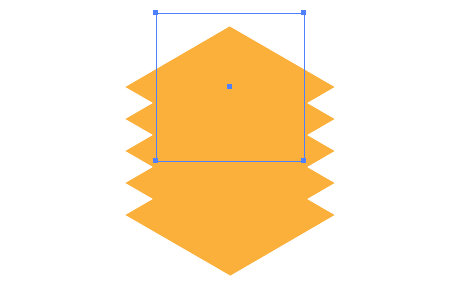
Use the Cmd/Ctrl + D shortcuts couple of times to repeat the last action.
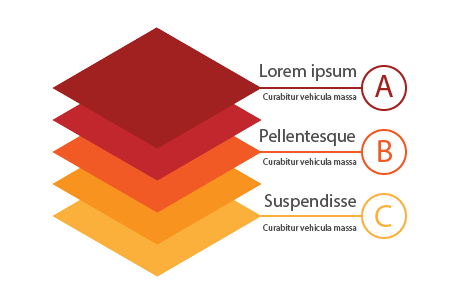
Recolor squares into different colors and add text objects. Layer chart is ready.
Step 5: Placing of 3D objects in isometric planes.
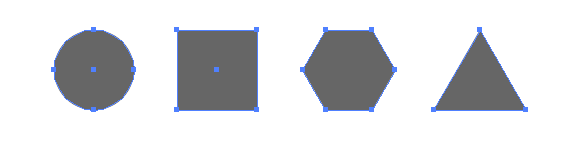
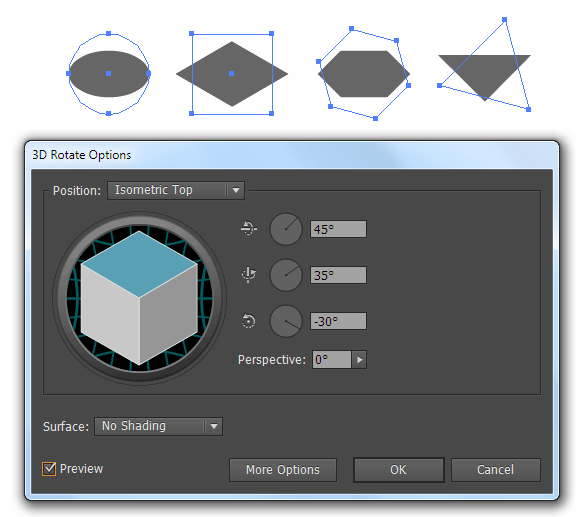
Often the basic 3D shapes are used as columns to graphs. These could be pyramidal and prismatic objects. Let’s see how they can be created in isometrics. Create basis for different types of prisms. These are a circle, a square, a hexagon and a triangle.
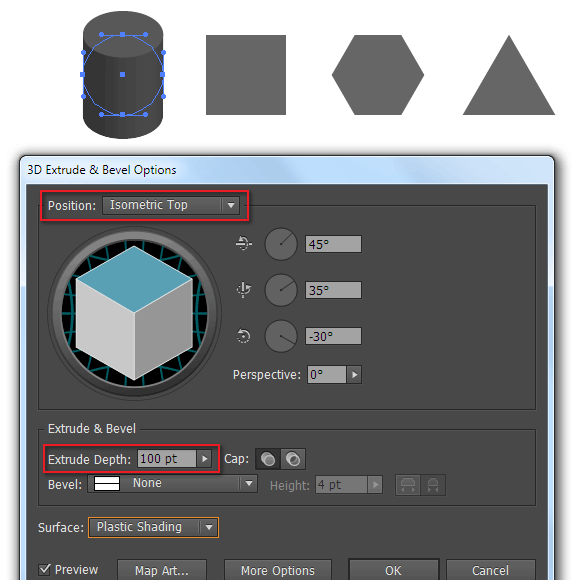
Select a circle then go to the Effect > 3D > Extrude & Bevel….In the opened dialog box select Isometric Top preset. By changing the Extrude Depth parameter we can control the heights of the object.
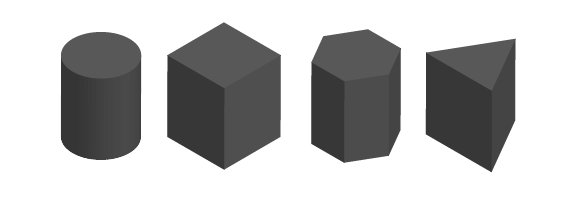
As you can see we received a cylinder.
Step 6
Do the same with the rest of the figures to receive the prisms of different shape.
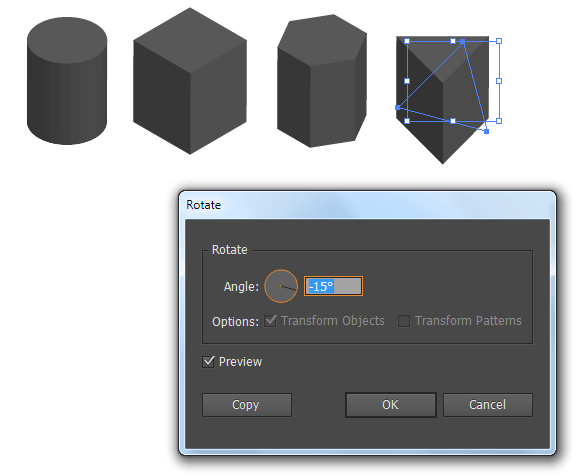
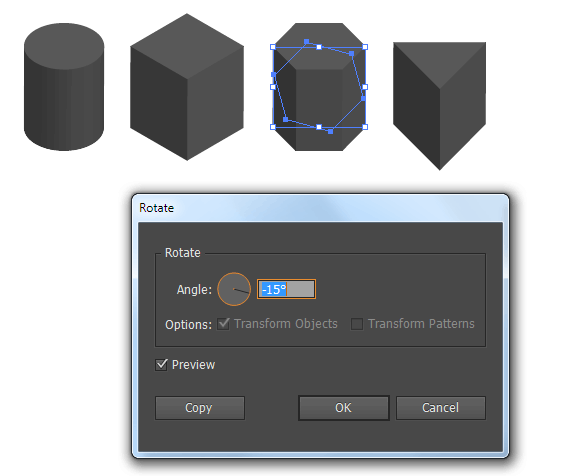
For a better visual perception you can rotate the base of the prism. So for triangular and hexagonal prism I rotated the base to 15 degrees (Object > Transform > Rotate…).
Step 7
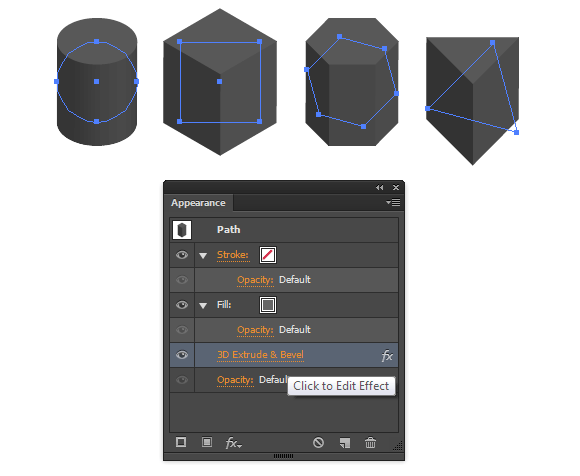
For further manipulation of these isometric vector infographic elements we need to transform them from 3D objects into regular vector objects. Select all the objects then open the dialog box of 3D effect by clicking on the link in the Appearance panel.
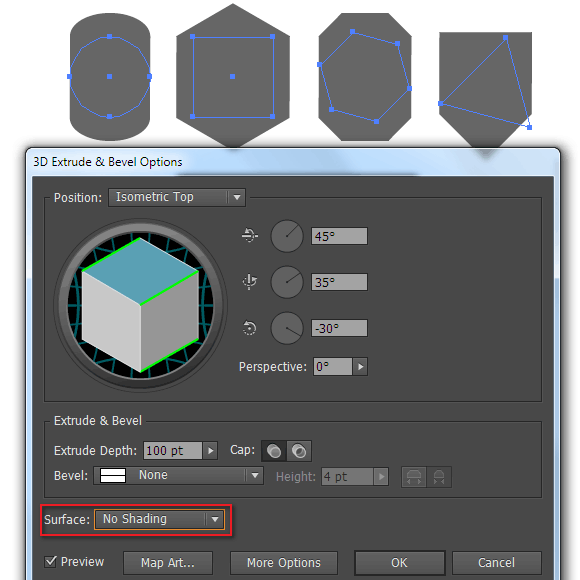
Here you need to select No Shading preset for Surface option. This will allow us to create fewer objects in the next step.
Step 8
Go to the Object > Expand Appearance.
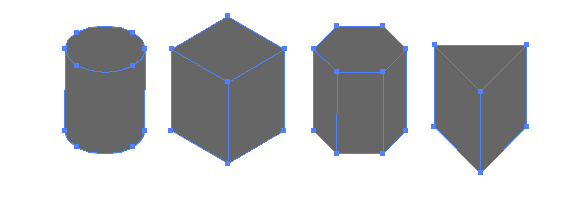
Color your isometric prisms. Now they are ready for further usage.

Step 9
And now let’s create a couple of elements and pyramids by using the same forms as basis. Apply the 3D Rotate effect and Isometric Top preset to every of it.
Go to the Object > Expand Appearance.
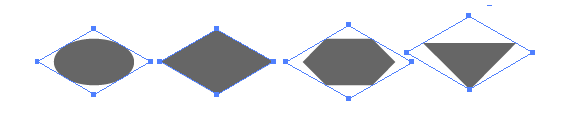
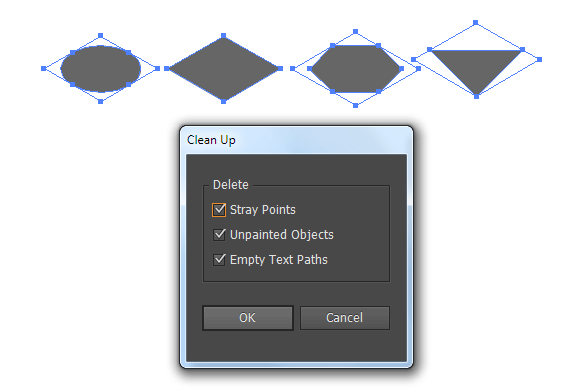
Now we need to get rid of the Clipping Masks, to do so, go to the Object > Clipping Mask > Release (Opt/Alt + Cmd/Ctrl + 7) then go to the Object > Path > Clean Up…
Step 10
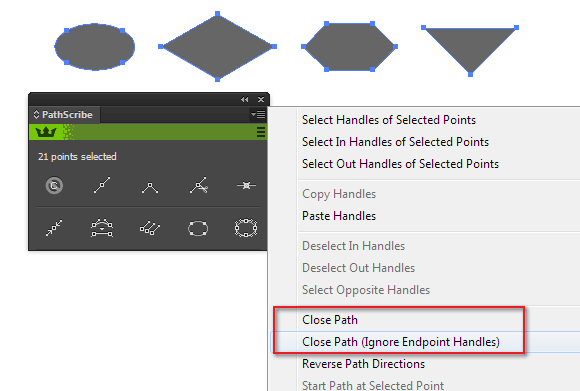
Unfortunately, as the result of these actions some paths might be open which can complicate our further editing.
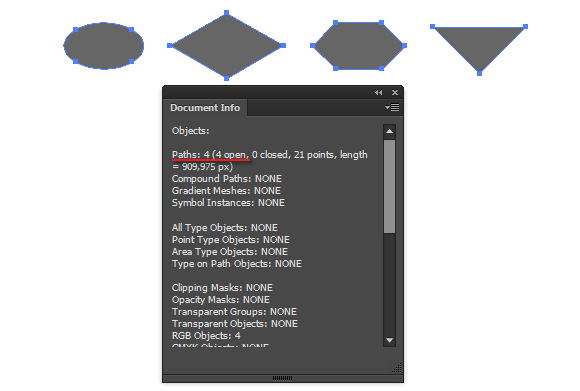
In this case you can use Close All Paths script to close your paths or VectorScribe plug-in which has the same function.
Step 11
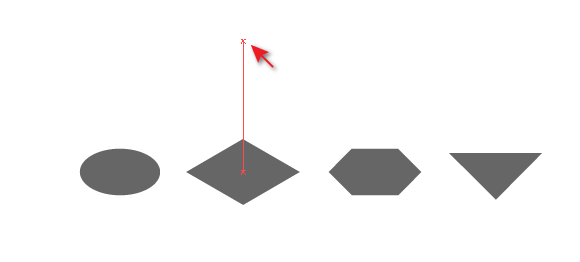
Create a point above the center of square base with the help of the Pen Tool (P).
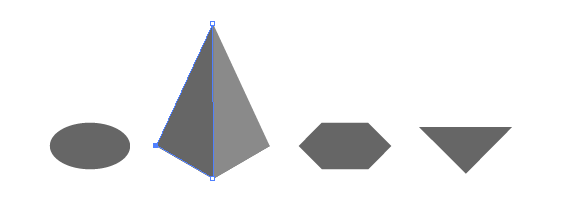
Join this point with two points of the base by creating one side of the pyramid. Now create the second side.
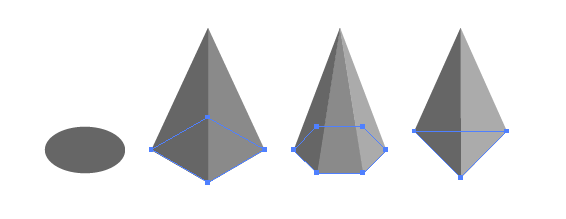
We’ll create other pyramids by analogy.
Step 12
Creating a cone could be trickier since the guide of the cone must be tangent to the ellipse of the base. But this is not a problem if we have all necessary tools. Create a point (this is a peak of a cone) above the center of the ellipse.
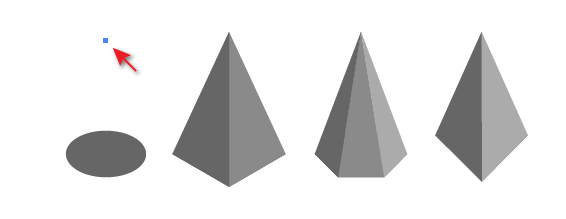
To create guides from this point to ellipse you can use the Common Tangents script or Free SubScribe plug-in which has a Line Tangent to Path Tool.
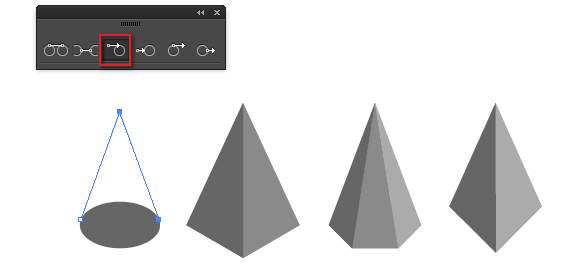
Delete the starting point and connect the tangent – our cone is ready.
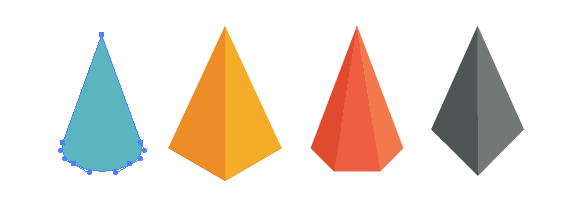
Our pyramids are ready for further use too.
Step 13
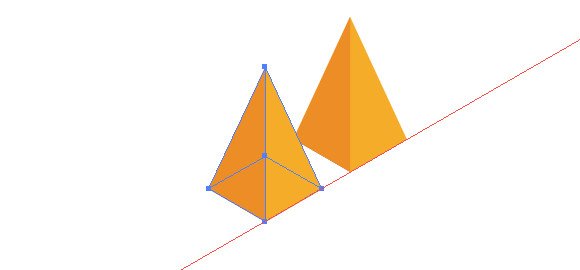
Now let’s create a graph from one of the created objects. Turn the vertical guide to 60 degrees (Object > Transform > Rotate…).

Now move the pyramid along the guide by holding Opt/Alt which leads to its duplication.
Step 14
Repeat the same action couple of times by using the Cmd/Ctrl + D shortcuts.

Now we can select the peak of every pyramid with the help of the Lasso Tool (Q) then change its heights.

All we have to do is to add the data and our isometric graph is ready.


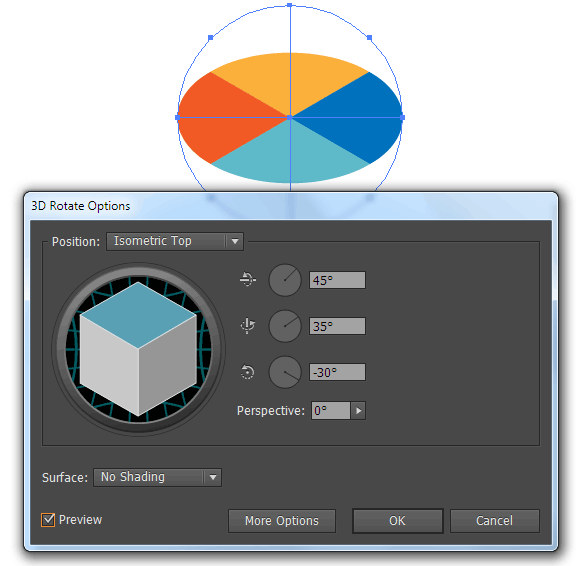
Step 15: Pie Charts and Shapes
Create a circle which we divide into 4 sectors as it is indicated on the figure below.

Apply 3D Rotate effect to the group of these objects.
Step 16
Go to the Object > Expand Appearance then to the Object > Clipping Mask Release (Opt/Alt + Cmd/Ctrl + 7) and Object > Path > Clean Up…

Close open paths with the help of the Close All Paths script or the VectorScribe plug-in.
Step 17
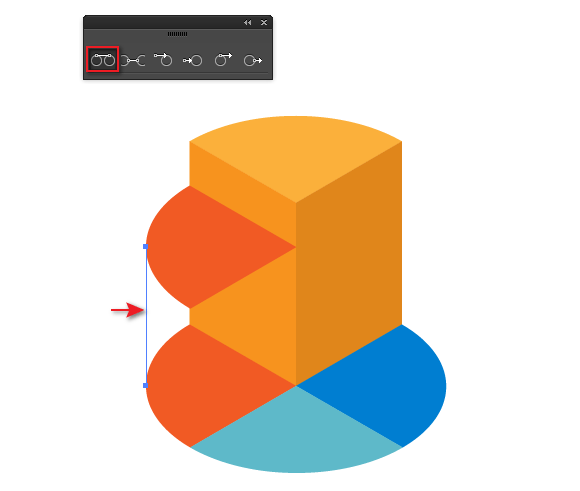
Double the yellow segment and drag the copy up.

On the base of two yellow forms create the sides of the segment with the help of the Pen Tool (P).

Step 18
Copy and paste and raise the copy of the red segment.

To create the left side of the segment we need to create a tangent to the curved parts of both red forms. And in this case the SubScribe and its Line Tangent to Two Paths Tool will help us.
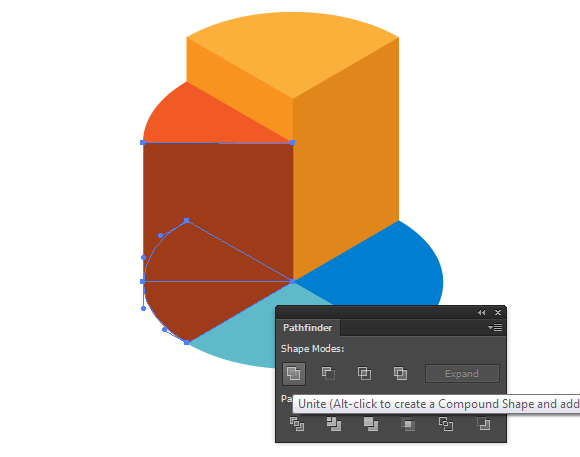
Step 19
Extend the created segment as it is indicated on the figure below.

Unite the new object with the lower form of red segment by clicking on Unite in the Pathfinder panel.
Step 20
Place the created form above the under red segment.

And now with the help of the Pen Tool (P) create a right side of the red segment.

Step 21
Create sides of blue and light-blue segments by using the described technique.


Now all we have left to do is to add text information.

And there you have it! You can now create and customize your own isometric vector infographic elements with ease. Enjoy!

Author: Iaroslav Lazunov
My name is Iaroslav Lazunov, I am a graphic designer from Ukraine. I am glad that I finally found a job in my life that I can share my knowledge and experiments with you in my tutorials. Follow me on Twitter or visit my blog Vectorboom.com


Finally I got what I need. Thanks for publish this amazing tutorial
This is a great blog.
Amazin!
Amazin!
Great news once again!
Wow, man. Really awesome tutorial and article.
Thanks.
Ps. If create some keys bind for 3D-transform it will be faster.